Chapter 2: Designing Logic Models
2.1 Introduction
2.2 What is a logic model?
2.3 Theory of change
2.4 Components of a theory of change.
2.5 Results Framework
2.6 Logical Framework (Log frame)
2.7 Objectives statements (Column 1)
2.8 Assumptions (Column 4)
2.9 Indicators (Column 2)
2.10 Measurement methods (Column 3)
2.1 Introduction
The first step in establishing the foundations of your MEAL system is to create logic models for your project. What is a logic model? In simple terms, a logic model is a snapshot of how your project is supposed to work. An effective logic model is not intended to be a detailed, comprehensive plan.

That comes later. Instead, a logic model provides an overview that addresses questions like:
● What is your desired impact?
● How do you believe change will take place?
● What assumptions need to hold true for the change to occur?
● How will you measure and track progress?
Do these questions sound familiar? They should, because they are also the fundamental questions you should ask when designing the MEAL system for your project.
In practice, a project develops more than one logic model. Together, the models align to map out how your project is supposed to work. This chapter explores three commonly used project logic models: the theory of change (ToC), the results framework (RF) and the Logical Framework (Logframe).
| By the end of this chapter, you will be able to:
✓ Describe how project logic models contribute to establishing a strong foundation for MEAL ✓ Compare and contrast the components, structure and purpose of theories of change, results frameworks and Log frames. ✓ Explain the purpose of identifying assumptions in project logic models. ✓ Interpret the vertical and horizontal logic of Logframes. ✓ Understand the characteristics of a SMART indicator. ✓ Identify the most common measurement methods and when they are used |
2.2 What is a logic model?
Logic model: A systematic, visual way to present a summarized understanding of a project and how it works.
At their core, logic models identify the project logic. They help teams articulate the desired long-term change and map out what needs to happen for that change to be achieved. However, in practice, logic models do much more.
The information contained in logic models is used by many stakeholders for multiple purposes.
● Project proposal writers Use logic models to prompt discussions about potential activities, resource estimates, calendars and risk management. ● Project managers Use logic models to communicate with stakeholders (communities, partners and others) to explain what the project will accomplish, and how. ● Business development staff Use logic models to explain the project logic and results to potential funders. ● Project teams Revisit logic models during project implementation, updating strategies and processes as they learn from experience, and adapt to unforeseen events. ● MEAL teams Use logic models as principle input of the design of MEAL systems.
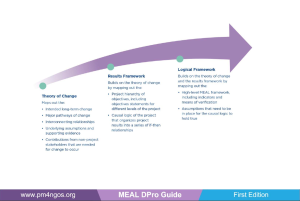
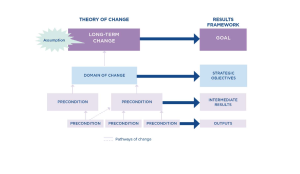
Each logic model (ToC, RF, Logframe) draws and builds on the information found in the previous tools. For this reason, it is best to create them in sequence. Figure 6 explores each of the three logic model tools, identifying the core content of each and comparing the purpose of each.
2.3 Theory of change
The theory of change provides the big picture of the intended change. It defines the long-term goal of a project and the broad strategic areas of intervention, and then maps the building blocks or preconditions, that need to be in place for the long-term change to occur. The ToC also identifies the assumptions that need to hold true for the project to succeed, and the evidence that is available to support them.
Theory of change: A comprehensive and visual description of how and why a desired change is expected to happen.
ToCs come in various formats, some quite simple and others complex. Accompanying descriptions can be written as a text document, but ToCs are more commonly supported with graphics, including flow charts, maps, network diagrams or tables.

There are many advantages to presenting the ToC in a visual format. These include the ability to:
● Visualize complex data and ideas in an image that is easier to understand. ● Identify the full range of changes needed to achieve the intended impact. These include changes that are implemented by other stakeholders. ● Recognize non-linear change. ● Make explicit the assumptions, i.e. the potential risks that could disrupt the logic of the project. ● Prompt discussion and participation by opening up space to ask questions, challenge assumptions and suggest alternatives.

The ToC should be based on a wide-reaching, comprehensive analysis of needs, assets, opportunities and the operating environment. This analysis should draw on stakeholder perspectives and local knowledge to ground the conversation in specific, real-life circumstances. The process of developing a ToC should be participatory, involving a cross section of staff (management, technical/sector experts and MEAL) and key stakeholders, to benefit from their many perspectives. There are software products available that generate a digital visualization of a ToC.
ToCs are stronger when they are evidence-based and deliberately informed by and aligned with research, theory, practice and experience. As you begin defining your ToC, identify any existing evidence-based conceptual frameworks that can inform your work.
Conceptual framework: A tested, evidence-based model for a development or relief intervention.
Review your donor’s requirements to see whether those guidelines mandate the use of a specific conceptual framework. For example, the USAID Office of Food for Peace (FFP) program requires that food security activities use its Conceptual Framework for Food and Nutrition Security. Where there is no such requirement, it is advisable to use an existing framework or to create one.

Some of the most commonly used conceptual frameworks for projects address challenges related to food security, nutrition and behavior change. They include:
● Food security: USAID FFP Conceptual Framework for Food and Nutrition Security.
● Nutrition: UNICEF Conceptual Framework for Maternal and Child Undernutrition and USAID’s Multi-sectoral Nutrition Conceptual Framework.
● Behavior change: FHI 360 Social and Behavioral Model for Change
2.4 Components of a theory of change
One of the best ways to understand a theory of change is by exploring and interpreting an example. Let’s visit the UNITAS team as it works on the Delta River IDP Project introduced below.
| The Delta River IDP Project case study
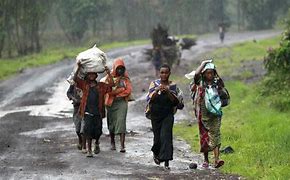
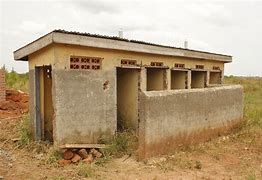
Background UNITAS, a nongovernmental organization (NGO), has worked in the Delta River Region for 10 years. It strives to reduce waterborne disease by working with communities to install latrines and water systems. It has also implemented behavior change campaigns aimed at improving sanitation and nutrition practices. UNITAS has strong relationships in the Delta River Region and has a network of partners that spans government ministries, NGOs and community-based organizations. The team has been approached by a donor to participate in an initiative designed to address the needs of internally displaced people who have moved to the region over the past 12 months.
Based on a preliminary situation analysis, UNITAS and the donor have identified three central problems that need to be addressed: 1. Internally displaced families lack access to agricultural production opportunities and income-generating activities. 2. Internally displaced women and children lack access to nutritious food. 3. There is an increased incidence of waterborne disease among IDPs compared to families in the surrounding communities. The donor is funding three implementing partners to address the issues outlined above. UNITAS is one of the three partners and has been asked to focus its efforts on decreasing the incidence of waterborne disease among IDPs. |
The UNITAS team, the project donor and the two other organizations contributing to the IDP response have worked together to conduct a situation analysis.
They have identified the issues that need to be addressed, and have turned the problems that contribute to those issues into possible opportunities for intervention. Next, the donor has asked that UNITAS contribute to the development of a ToC (Figure 7) that maps out its intervention strategy for the proposed IDP initiative.
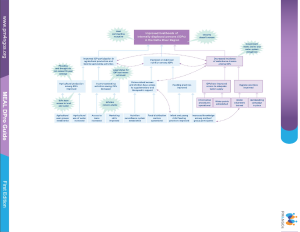
Let’s take some time to understand the logic in the UNITAS theory of change.
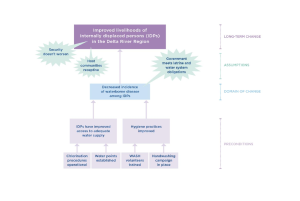
The long-term change
Long-term change is the desired lasting impact that the intervention aims to support. In the case of the Delta River IDP Project, the situation analysis that was conducted earlier gave rise to a possible desirable long-term change. Working together, the team agrees to the following wording for the long-term change and places it at the top of the ToC:
“Improved livelihoods for internally displaced people in the Delta River Region.” |
2. Preconditions and pathways of change
Preconditions are the building blocks of the ToC. They are the requirements that must exist for the long-term change to take place.
Starting with the long-term change, the team engages in a ‘backwards mapping’ process, asking what preconditions are required for that long-term change to be achieved. At the highest level, the ToC identifies three areas, or domains, of change that will contribute to the long-term change.
Domains of changes are the broad strategic areas of intervention that most directly contribute to achieving the long-term goal of the ToC.
| Increased IDP participation in agricultural production and income-generating activities |
Improved or stabilized nutrition among IDPs
|
Decreased incidence of waterborne disease among IDPs |
Note that the one of the domains, “Decreased incidence of waterborne disease among IDPs,” is the intervention area on which the donor has asked UNITAS to focus its efforts (purple-shaded, bordered boxes). The other two domains, represented by blue-shaded boxes in the ToC, will be the responsibility of other collaborating organizations.
You might ask, “Why are these other domains of change that are not the direct responsibility of UNITAS included in the ToC?” Remember! The ToC provides a big picture of what is needed to achieve the long-term goal. A ToC can include preconditions and pathways of change that are not the direct responsibility of your project. It is important to include them in the ToC because they are fundamentally important to achieving the long-term change; they cannot be ignored! This in turn implies the need to seek partnerships with other organizations to ensure a holistic project that addresses all the major preconditions and pathways.
Once the domains of change have been identified, the team continues to work backwards, identifying the preconditions that will lead to success in each domain, and organizes them into pathways of change.
Pathways of change identify the connections between preconditions, how they relate to each other and in what order. Most initiatives have multiple pathways that contribute to the long-term goal. The figure below shows the preconditions and pathways of change for the domain of change assigned to UNITAS, namely, “Decreased incidence of waterborne disease among IDPs.”
As you review the Figure, notice that UNITAS will need to manage several pathways of change that it is anticipated will contribute to a decreased incidence of waterborne disease among IDPs. Along the different pathways toward realizing the desired long-term change, a series of preconditions, involving different stakeholders, will need to be met.
3. Assumptions
As you develop your ToC, you will need to determine whether there are any assumptions that will seriously affect your project’s ability to deliver on its commitments. Ask yourself, “What are the top three assumptions that need to be valid for our project to be successful?”
Assumptions: are the conditions or resources outside the direct control of project management, but that nevertheless must be met for progress to be made toward the eventual achievement of the long-term goal.
We all make assumptions when we design and plan our projects. For example, we might assume that:
● Government plans, policies and actions will support our work
● Election results will lead to a stable transfer of power
● Other organizations will continue to operate in the same area
● Trends in national and international markets will be favorable.
● Communities are interested, motivated and have time to engage.
● Project staff can operate safely with full freedom of movement
Assumptions provide a reality check for your theory of change. Assumptions point out the potential risks that can interfere with project success. Everything will proceed well if the assumptions you have identified prove correct. However, unfulfilled assumptions can completely alter how, or even if, your project works. Thus, UNITAS needs to identify and analyze those key, or critical, assumptions that are required for the project to succeed, and must carefully verify that they are likely to hold true.

As you identify your ToC assumptions, it will be important to develop a plan to gather the evidence that will confirm whether these assumptions will hold true.
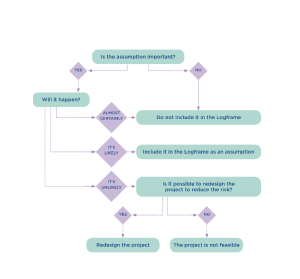
● If evidence indicates that the assumption will almost certainly hold true, then you probably don’t need to include it in the ToC.
● If evidence indicates that the assumption is likely to hold true, but there is some risk, then include it in the ToC and commit to monitoring its status.
● If evidence indicates that your assumption will NOT hold true, you will need to redesign this part of the project. Note: If there are no options to redesign the project, then your project may not be viable.
If you are unable to find evidence relating to an important assumption, you may need to decide how best to gather evidence so that you can determine into which of the three categories above the assumption resides.
Be careful of any “killer assumptions”. These are assumptions that you expect to hold true, but the evidence suggests are unlikely to be realized and could potentially “kill” the project. Returning to the assumptions in the Figure, note that the success in reducing waterborne disease assumes that the “Government meets latrine and water system obligations.” The team developing the ToC needs to confirm that the government will meet its commitment. If it is unlikely that the government will fulfil its obligations, then this becomes a “killer assumption” and an alternative approach must be found for the project to succeed.
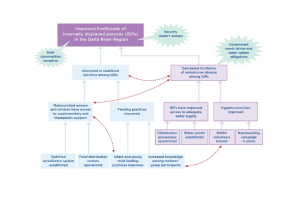
4. Connections between the pathways of change
Finally, as you review the ToC, you will find that some preconditions contribute to more than one pathway of change. Figure 9 below provides a partial elaboration of the ToC, focusing on two domains of change. Notice there are a number of preconditions that contribute to multiple pathways of change. The connections between these preconditions are represented by dashed lines across pathways of change, indicating the need for coordination. It is important to explicitly identify when preconditions feed into multiple pathways of change, because often this requires that you establish strong communication and coordination between the people working on the different change pathways. For example, the water, sanitation and hygiene (WASH) volunteers will be trained as part of the UNITAS project, but they will also support the work of mothers’ groups (which are managed by a different team through a partner project).

| Critical thinking: Treat the theory of change as a living document
If the theory of change is treated as a static document, teams will assume it must be accepted and followed, even after it becomes clear that it does not accurately reflect the project context. Logic models should be considered living documents and updated as needed or when new information is reported. Revisit and test your logic models throughout the life of the project to ensure they are accurate. Donors are increasingly supportive of this kind of review process. Depending on the project, this could be a ToC reflection event on an annual basis or at the project’s midpoint or closure. It is important to document your learning and share it with donors and other stakeholders so that new projects do not inherit an outdated or flawed ToC. As you reflect on the ToC, keep an eye out for any “blinds spots” and “prevailing myths” that may undermine the validity of your logic models. Blind spots are unintentional omissions in thinking or errors that happen because of habit, snap judgments or overconfidence. Eventually, these blind spots appear in your models because models represent how you think. Prevailing myths include misguided assumptions like “access equals use,” “knowledge equals action,” and “activities equal outcomes.” In practice, good logic models require several rounds of revision before they provide an accurate picture of how your project works.
Think of an experience when your theory of change did not accurately reflect your project context or reflect your intended project logic. • What do you think led to these weaknesses in your logic model? • Did you update the ToC to address these weaknesses? Why or why not? • Given this experience, what would you do differently next time during ToC design? |
2.5 Results framework
Now that the UNITAS team has completed its ToC, the next step is to translate its contents into a results framework (RF).
Results framework A logic model that organizes the results of a project into a series of if–then relationships. The statements in the RF articulate the project’s hierarchy of objectives, describing the causal (or vertical) logic of the project.
The results framework, like the ToC, maps out the logic of the project strategy. The logic underlying a program or project is perhaps easier to understand at a glance in the results framework.
However, the ToC and the results framework differ in one important way. You will recall that the ToC was a big-picture document that identified all the preconditions required to achieve long-term change, whether they were in or outside of the project’s direct control, including the changes that other actors were expected to accomplish. The RF is different: it only includes interventions that are the direct responsibility of the project team.

It is important that the project team clearly identifies and prioritizes the criteria it will use to decide what will be included in the RF, and what will not be included (Figure 10). The discussions that frame these decisions need to be well-managed so that different opinions, perspectives and requirements can be voiced in a way that is respectful and constructive. Don’t forget to consider the perspectives and requirements of partners, donors and other stakeholders when making these decisions.
| Category | Illustrative criteria |
|
Needs prioritization |
• Which needs received the highest level of emphasis during the assessment/analysis?
• Addressing which needs would appear to have the highest potential for impact? • Who stands to benefit the most? • How will the different needs relating to gender, age and socioeconomic status be accommodated? |
| External program considerations | • Who else is working in the proposed area of intervention? What are their program strengths? |
|
Appropriateness |
• Is the proposed approach acceptable to the target population and key stakeholder groups? For example, would a reproductive health program be appropriate and consistent with religious and cultural norms? |
| Institutional capacity | • What are your organization’s strengths and weaknesses?
• What are your implementing partners’ capacity levels? |
| Resource availability | • Is funding available?
• Is there potential for growth? • What opportunities exist to obtain additional resources? |
| Financial/economic feasibility | • Is the project investment justified based on the anticipated return? |
| Technical feasibility and sustainability | • Can the proposed work be realistically accomplished?
• Can the work be sustained and maintained? |
| Strategic considerations | • What are the strategic priorities for your organization in the region? Country? Other? |
| Portfolio considerations | • Does the project fit within the larger portfolio of projects in your organization? |
Once these strategic decisions have been made, you will be able to identify what is inside—and outside—of the scope of the results framework, and you can begin mapping content from the ToC to your results framework.
As is the case with all logic models, the RF will vary in terms of the number of levels and the terms used to describe those levels. The RF template used by your project will depend on your donor’s requirements or, failing that, those of your organization.
The figure below compares some of the variations—in terms of levels and language—between commonly used RF models in the development sector. With a complicated ToC, there will not necessarily be an obvious alignment between the levels of the ToC and the levels of the RF model you use. You will need to use a certain degree of judgment as you move content between the two logic models.
|
Organization
|
Longer-term change | Mid-higher level change | Mid-lower level change | Tangible deliverables
|
| Kellogg foundation | Impact(s) | Outcome(s) | Outputs | |
| The Bill and Melinda Gates Foundations | Strategic goal | Primary outcome | Intermediate outcome | |
| USAID Results Framework | Development objective(s) | Intermediate results | Sub-intermediate results | |
This Guide to the MEAL DPro uses a four-level RF model that includes a hierarchy of objectives made up of a goal, strategic objectives, intermediate results and outputs. Note how the inclusion of outputs—often thought of as the project deliverables—clarifies the project’s chosen intervention strategy in a tangible way. Particularly with the inclusion of some key outputs, the results framework can be a very useful communication tool, showing what the project intends to achieve, and how, in a simple but not simplistic manner.
| Level | Description |
|
Goal. |
The goal describes the longer-term, wider development to which the project contributes. Goal statements are usually aspirational, focusing on states of sustainability, livelihood, well-being, etc |
|
Strategic objectives (SOs) |
The SOs express the central purpose of the project. They describe the significant benefits that are anticipated by the end of the project. In most cases, the SOs address the immediate causes of the core problem. |
|
Intermediate results (IRs) |
The IRs express the expected change(s) in behaviors, systems, policies or institutions as a result of project outputs and activities.
For example: Project participants adopting new behaviors or skills promoted by the project; expansion of project reach or coverage; new ways of organizing or managing systems; alterations to policy; or anything else that shows project outputs being used by the targeted participants. These are called “intermediate” because progress at this level is a necessary step toward achieving the SOs. There may be more than one IR for each SO. |
|
Outputs |
Outputs are the deliverables resulting from project activities. They include products, goods, services, knowledge, skills and attitudes. (e.g., people trained with increased knowledge and skills; quality roads built). There may be more than one output for each IR. |
The descriptions of the objectives levels in Figure 12 outline the types of statements found at each level of the RF. Your objectives statements should reflect the scale and complexity of your specific project. For example, a 1-year project can expect to achieve an SO that will be remarkably different from that of a 5-year project. Judgment is required as you write objectives statements.
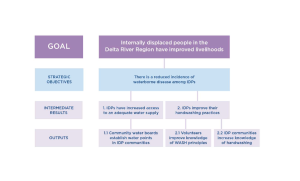
Figure 13 provides an example of translating the contents of a ToC into an RF that uses the MEAL DPro four-level RF template:
● The goal level in the RF is consistent with the long-term change identified in the ToC.
● The strategic objectives level in the RF corresponds with the ToC statements found at the domains of change level.
● The intermediate results and outputs levels correspond with the preconditions of the ToC.
Remember, however, that not all preconditions of the ToC are included in the RF, only the ones that are the responsibility of your specific project.
To better understand the components of the RF, let’s return to the UNITAS project. In collaboration with partners, donors and community members, the project team created the following RF.
Write all objectives statements clearly, using full sentences, and be sure to include information indicating:
● Who changes? Individuals? Communities? Populations? Governments? Institutions?
● What changes? Coverage? Behavior? Knowledge? Technologies? Models? Data? Systems? Policies?
● What is the direction or nature of the change? Increased? Decreased? Improved? Reduced? Adopted? Established? Used? Integrated?
Figure 15 provides additional guidance for writing objectives statements at different levels of the RF.
| Objective statements | How to write |
|
Goal |
Write as a full sentence, as if already achieved. Make the general communities of the intended participants the subject of the sentence. |
|
Strategic objectives
|
Write as a full sentence, as if already achieved. Make the targeted participant group(s) the subject of the sentence. |
|
Intermediate results |
Write as a full sentence, as if already achieved. Make the specific individuals or groups whose behavior is expected to change the subject of the sentence. |
|
Outputs. |
Write as a full sentence, as if already achieved. Make the specific individuals or groups receiving the outputs the subject of the sentence. |
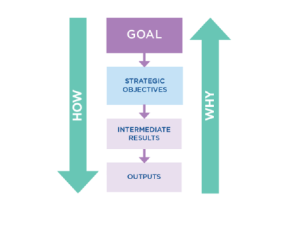
The vertical logic of the project becomes clear as you explore the linkages between the levels of the RF. The logic of the hierarchy is organized as follows:
● The long-term change is articulated at the top of the hierarchy.
● Going down the hierarchy of objectives demonstrates how a result will be achieved by achieving the result(s) below it.
● Going up the hierarchy of objectives demonstrates why a lower-level result is necessary to achieve the next-level result.
2.6 Logical Framework (Logframe)
Once the RF is complete, the next step is to develop the project’s Logical Framework or Log frame.
Logframe: A logic model that describes the key features of the project (objectives, indicators, measurement methods and assumptions) and highlights the logical linkages between them. With the inclusion of these additional items, the Logframe provides the basis for later developing the MEAL plan. Like the theory of change and the results framework, the Logframe is intended to communicate the purpose and main components of a project as clearly and simply as possible.
However, the Logframe includes information that is missing in the ToC and the RF. More specifically, it includes:
• Indicators are measures used to track progress, reflect change or assess project performance.
• Measurement methods identify how the project will gather the data to track the progress of the indicators.
As is the case with all logic models, there are many variations of Logframes. This guide uses a five-level matrix to structure the Logframe.
| Objectives statements | Indicators | Measurement methods | Assumptions |
| Goal | |||
| Strategic objectives | |||
| Intermediate results | |||
| Outputs | |||
| Activities |
2.7 Objectives statements (Column 1)
The first column of the Logframe includes the objectives statements that were first created for the RF. As discussed previously, the objectives statements define the “vertical logic” of the project.
You probably also noticed that the Logframe includes an objectives statement that was not included in the results framework: activities.

Activities describe the work that will be conducted to deliver the project outputs.
The RF did not include any activity-level statements, so you will need to develop those statements to include in the Logframe. Examples of activities for the Delta River IDP Project include:
At the higher levels of the Logframe (the goal and strategic objectives), the objectives statements tend to be more strategic, and focus on articulating the outcomes of the project. Progress against these objectives statements is tracked by conducting evaluation activities. To track progress, you will need to answer evaluation questions such as: Is the project resulting in the changes we projected? Are the changes sustainable? Have there been changes in behavior? Are new practices being adopted?

At the lower levels of the Logframe (outputs and activities), the objectives statements tend to be more operational, and focus on articulating the outputs of the project. Progress against these objectives statements is tracked by conducting monitoring activities. To track progress, you will need to answer monitoring questions such as: Did we do what we said we would? Are we delivering the products and services we indicated?
2.8 Assumptions (Column 4)
Before completing columns 2 and 3 (indicators and measurement methods), it is helpful to first complete column 4 of the Logframe, the assumptions.
Assumptions are especially important in the Logframe because they complement the “vertical logic” of the hierarchy of objectives by introducing the “horizontal logic” of the project. In an ideal world, the vertical logic would always hold true: activities result in outputs, outputs result in intermediate results, and so on. Making the assumptions explicit provides a reality check by pointing out that vertical logic succeeds if and only if the assumptions at each level of the Logframe hold true.
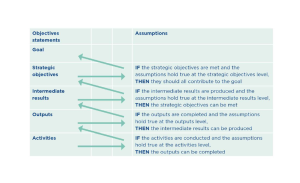
We already learned about assumptions in the earlier discussion of the ToC. In principle, you can copy the ToC assumptions into your Logframe. Remember that the ToC is a much larger view of the entire context of the project, so it includes assumptions that might not directly impact the objectives statements in your Logframe.

The decision tree in the figure below can help your team decide which assumptions to include in the Logframe. Take time to review the assumptions to make sure the project design has done as much as possible to minimize the risk associated with them and has identified those that will need validating.
2.9 Indicators (Column 2)
Identifying the right indicators is a critical step in the MEAL process, because the indicators become the building blocks of your MEAL planning and implementation.
Indicator: A measure used to track progress, reflect change or assess project performance.
When identifying indicators for the Logframe, start by asking “What information do I need and why do I need it?” Ask yourself, do I need data to:
● Comply with donor reporting requirements?
● Appreciate the level of project progress and achievement?
● Analyze any variance between expected and actual performance?
● Understand how change is happening? Understand why change is happening?
● Share and discuss results with community groups, government agencies or other organizations?
Your answers to these questions will help you identify which indicators you should use, and the number of indicators you will need. For example, while your donor might require a specific indicator to inform its reports, you might need a different type of indicator to inform your decision-making and to provide updates to communities.
Critical thinking: How many indicators? Each objectives statement will require at least one indicator, and sometimes more depending on the information you need. However, more is not necessarily better! Remember, collecting data to track indicators takes time and money. The key to a good set of indicators is their quality and usefulness. Be careful not to collect information that you don’t need, or won’t use. Think of an experience where you identified more indicators than were needed to track your objectives statements? ● What happened? ● What were the implications and the impact of identifying too many indicators? ● Knowing what you know now, what would you have done differently? |
The type of information you need will also depend on the type of objectives statement the indicator is intended to track.
|
Objectives statement
|
Indicator description |
|
Goal
|
In general, a project Logframe would not include indicators at this level. Goal-level indicators reflect longer-term impacts that are usually not achieved through the completion of a single project. Rather, they may require changes brought about by multiple initiatives. |
|
Strategic objectives
|
Indicators reflect change that is sought, often from a single initiative, among extended participants, target populations, and partners |
|
Intermediate results
|
Indicators reflect the expected change(s) in identifiable behaviors of a specific group or the expected change(s) in systems, policies or institutions required to achieve the higher outcome. |
|
Outputs |
Indicators represent tangible goods and services delivered by the initiative. Examples of output-level language include: people trained with increased knowledge and skills, quality roads built, goods delivered and services performed. |
|
Activities
|
Unless specifically mandated by your organization or a donor, Logframe templates do not typically develop indicators to track completion of activities.
This is because: • Activities indicators are often stated in the activity descriptions themselves. • It is increasingly common to manage activities as part of a detailed implementation plan, not in the Logframe |
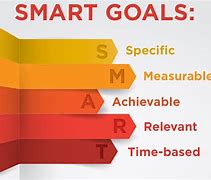
Once you are clear about the information you need, you can begin to identify your Logframe indicators. As you identify indicators, you can use the SMART indicator checklist (Figure 20) to determine whether they meet quality standards. SMART is an mnemonic that identifies five criteria—specific, measurable, achievable, relevant, time-bound—that together help teams assess the quality of project indicators.
|
Specific. |
Indicators must be very closely related to the desired areas of improvement expressed in the objectives statements that they represent, and should include the following characteristics:
● Quantity The expected numerical representations of what is to be achieved. ● Quality The expected achievements described using words and/or graphics. ● Location The geographic boundary of the expected achievements. ● Target population The person or people expected to make/experience the anticipated change. |
| Measurable | Indicators should be written in a way that promotes an accurate assessment of progress. |
| Achievable. | Indicators must be attainable given the budget, time and resources available. |
| Relevant. | Indicators must accurately measure the change you want to track. |
| Time-bound | Indicators must identify the timeframe within which the change is expected to occur. |
To understand the components of strong indicators, let’s examine two indicators that were created for the Delta River IDP Project. As you review the two indicators, it is clear they are written in a manner that is specific, measurable and time-bound. As a final step in assessing the quality of the indicator, the team will need to determine whether the indicators are also achievable and relevant.
|
Indicator statements |
Each quarter, 100 percent of water points managed by community water boards meet WHO water quality standards. | By Year 3 of the project, 80 percent of IDPs demonstrate knowledge that hands need to be washed with soap after critical events. |
| What is measured | Water quality | Knowledge that hands need to be washed with soap after critical events. |
| Target population | Water points managed by community water boards |
IDPs |
| Unit of measurement | Percentage | Percentage |
| Direction, size or magnitude of the change |
100 percent |
80 percent |
| Time frame | Quarterly | By Year 3 of the project |
What type of indicator best collects the information I need?

Standard or custom indicators?
Before you invest time and money in creating indicators, explore whether there are standard, validated indicators that can be reused or repurposed for your needs. The reasons to use standard indicators that go beyond saving time and money include:
Indicator quality: Standard indicators have been tested in previous projects and in multiple contexts. As a result, they are globally recognized for their quality and have a track record of providing valid and reliable data.
Donor requirements: Always review your funding agreements to confirm whether donors require the use of specific indicators.
Data aggregation: Using standard indicators helps organizations compare data across the organization and across the sector. This makes it possible to compare results and communicate across multiple projects and programs.
Hundreds of standard indicators already exist for projects. These include indicators for food security, nutrition, health, WASH (water, sanitation and hygiene), shelter, education, protection, financial inclusion, gender, governance, agriculture, and maternal and child health. Many resources have been created to support the use of standard indicators.

Figure 22 identifies some of the more extensive and exhaustive resources for identifying standard indicators.
| Resource | Description and primary intended use |
| Indikit | An online resource for well-formulated initiative indicators, and guidance on how to correctly collect and analyze the data required for each indicator. |
| Sphere Minimum Standards | An internationally recognized set of common principles and universal minimum standards in humanitarian response. |
| USAID | A list of recent indicator resources across sectors, including indicator handbooks, databases, tools and indices. The resources are both internal and external to USAID. |
| Bond Impact Builder | An online hub of outcomes, indicators and data collection tools designed to help organizations monitor and evaluate their initiatives. |
| Feed the future indicator Handbook | A set of performance management indicators for phase 2 of the United States Government’s Feed the Future initiative. |
In general, standard indicators are recommended and preferred whenever possible, especially for higher-level objectives. However, there will be occasions when standard indicators are not available or do not meet your specific information needs. In those cases, you will need to develop a custom indicator.
Returning to the example of the Delta River IDP Project, the UNITAS team needs to identify an indicator for Intermediate Result 1: “IDPs have improved access to adequate water supply.” The team chooses a standard indicator that is based on guidance from WHO for the minimum amount of water needed for drinking, cooking and washing.8 The indicator states, “By Year 3 of the project, an average of 30 liters of water per person per day is available to IDPs through a water point.”
Direct or indirect (proxy) indicators?
Often it is relatively easy to track change by directly examining whatever you are trying to measure. For example, if you want to know how many wells were built, water agents trained or community visits conducted, you can measure the progress using a direct indicator.

Direct indicators track change by directly examining what you are trying to measure.
However, there will be many cases where change cannot be measured directly and you need to identify indirect indicators that approximate change in the absence of a direct measure.
Indirect or proxy indicators track change by examining markers that are generally accepted as being proxies for what you are trying to measure. Proxy indicators are especially helpful when the result you are attempting to monitor is difficult to measure or too expensive to measure. For example, the number of group meetings can be used as a proxy measure of group success. Be careful, however, because it is difficult to find proxy indicators that consistently and reliably represent what you are trying to measure.
Returning to the example of the Delta River IDP Project, the UNITAS team needs an indicator for Intermediate Result 2: “IDPs improve their handwashing practices.” The team needs to decide whether to use a direct indicator (direct observation) or a proxy indicator (the presence of soap and water at latrine locations). Figure 23 identifies the advantages and disadvantages of each type of indicator when measuring changes in handwashing practices.
| Indicator example | Advantages | Disadvantages |
| Direct indicator: By Year 3 of the project, 80% of IDPs increase hand washing at critical times. | ● The indicator attempts to directly assess hand washing behavior. | Collecting data requires:
● More time and budget. ● Skilled observers Observing hand washing could change the behavior of community members. |
| Proxy indicator: Both soap and water are consistently present at latrine locations. | ● Research shows that the presence of soap and water is associated with increased hand washing.
● Collecting this proxy data is easier and less expensive than direct observation of hand washing. |
Cannot reveal the frequency, consistency or quality of hand washing by individuals |
Quantitative or qualitative indicators?
Lastly, you will need to decide whether you require a quantitative or a qualitative indicator to measure progress toward your objectives statements.
Quantitative indicators are measures of quantities or amounts. They help you measure project progress in the form of numerical information, such as:

● Numbers
● Percentages
● Rates (e.g., birth rate: births per 1,000 population)
● Ratios (e.g., sex ratio: number of men to number of women)
An example of a quantitative indicator from the Delta River IDP Project Logframe is, “By Year 3 of the project, 85 percent of IDP households are located no more than 500 meters from a water point.”
Qualitative indicators measure judgments, opinions, perceptions and attitudes toward a given situation or subject.
An example of a qualitative indicator might be “Female IDPs feel safe collecting water from IDP water points.” Note that this indicator is much more subjective than the earlier quantitative indicator that measured proximity of IDPs to water points. Data related to feelings of safety are not as easy to analyze statistically. However, qualitative data is invaluable because it helps explain how things are changing, and why.
Because qualitative indicators are often subjective, it is important that they are defined clearly and concisely. For example, what does “safety” mean in the context of this indicator? While it is important to define these subjective terms, it is also important to recognize that the definitions may change over time. This is not necessarily a problem, because qualitative indicators have the advantage of exploring and explaining how definitions and perceptions change over time.
| Participation: The SPICED approach to developing indicators
There is an advantage to developing project objectives and indicators, especially qualitative indicators, in close collaboration with local communities. Often community members have the best perspective, knowledge and experience to identify what needs to change and how to understand and measure that change. The SPICED framework was developed to help teams collaborate more effectively with communities to develop indicators. The SPICED approach believes that indicators developed collaboratively are stronger when they are: Subjective : Community groups and individuals have perspectives and experience that give them unique insights that may yield a very high return on the investigator’s time. In this sense, what others see as anecdotal becomes critical data because of the source’s value. Participatory: Indicators should be developed together with those best placed to assess them. This means involving an initiative’s ultimate participants, but it can also mean involving local staff and other stakeholders. Interpreted and communicable: Locally defined objectives/indicators (created through participatory methods) may not be immediately clear to other stakeholders, so they often need to be explained (interpreted) for a wider audience. Cross checked and compared: The validity of assessments needs to be cross checked by comparing different indicators and progress by using different informants, methods and researchers. Empowering: The process of setting and assessing indicators should empower those involved and allow groups and individuals to reflect critically on their changing situations.
Diverse and Disaggregated: There should be a deliberate effort to seek out different indicators from a range of groups especially men and women This information should be recorded in a such a way that these differences can be assessed over time. Think of a situation where greater participation increased, or would have increased, the quality of your indicators. ● What contributions would community groups and individuals have added that would have improved the indicator quality? ● Were there any challenges that prevented you being more participatory in the development of indicators? ● How would the results of your project improve through the use of indicators that were informed and defined by community groups and individuals? |
2.10 Measurement methods (Column 3)
The fourth column of the Logframe identifies the measurement methods that will be used to collect data about your indicators.
Measurement methods identify how the project will gather the data to track the indicators. Measurement methods can be divided into two categories: quantitative and qualitative.
Quantitative methods collect data that can be counted and subjected to statistical analysis. As the term indicates, quantitative methods measure quantities, whether they be pure numbers, ratios or percentages. Quantitative indicators are very widely used in development projects as they give a very clear measurement, and quantitative data are easy to compare over time (or between projects). Examples of quantitative measurement methods include tracking logs, questionnaires, structured observation, knowledge and achievement tests, and physiological health status measures.

Qualitative methods capture participants’ experiences using words, pictures and stories. This qualitative data is collected through prompting questions that trigger reflection, ideas and discussion. Qualitative data are analyzed by identifying themes, topics and keywords. Qualitative data track changes in participants’ attitudes and perceptions, identify why and how change is happening, and are analyzed by organizing emerging themes. Qualitative measurement methods are especially good at answering the questions “How is change happening?” and “Why is change happening?” The three most common qualitative methods are semi-structured interviews, focus group discussions, and participant observation.
If you compare quantitative and qualitative measurement methods, you will find that each approach has its own strengths and weaknesses (see Figure 24).
| Strengths | Weaknesses | |
|
Quantitative methods |
● Scalable Processing results from a larger number of subjects
● Generalizable Using data gathered from a sample, assumptions can be made about patterns in the general population. ● Objective There is less personal bias in the collection and analysis of data. ● Standardized Data collectors use standard approaches whose results can be compared to other data. ● Suited to ICT4D Well-suited to use of digital devices for data gathering and analysis |
● Results from quantitative methods sometimes miss the depth and complexity of an issue.
● Not suitable for identifying and exploring unanticipated or unexpected factors. |
|
Qualitative methods |
● Provide depth and detail Provide detailed descriptions of situation, providing a rich context.
● Create openness Encourage people to expand on their responses and potentially open up new areas of inquiry. ● Simulate people’s individual experiences Provide a detailed picture of why people act in certain ways and the feelings behind these actions ● Identify the unexpected Helpful for identifying and exploring unanticipated or unexpected factors. |
● Results from qualitative methods are harder to generalize to a larger population.
● Data are relatively difficult to collect and analyze. ● Data are susceptible to the hidden bias of collectors and participants. ● More difficult to transcribe data directly to digital devices |
Using either quantitative or qualitative measures alone may be insufficient for tracking and understanding change. That is why today’s MEAL practitioners often advocate for a mixed approach that employs both types of measurement methods.
A mixed-methods approach deepens understanding of the project, providing more comprehensive, integrated data for tracking progress, analyzing results and making decisions. Using both quantitative and qualitative measurement methods offers the potential to answer very different questions about the same indicator.
Such an approach can give a sense of the direction and degree of change along with an understanding of what has contributed to, or inhibited, this change. And, a mixed-methods approach can strengthen your data, analysis and interpretation if you consciously incorporate a process called triangulation.
Triangulation The validation of data through cross-verification of more than two sources. In other words, teams triangulate by collecting data using a mix of methods. This allows teams to cross-check and reinforce results. Thus, triangulation helps overcome some of the weaknesses of the methods outlined above. Planning and incorporating the concept of triangulation into your data collection and analysis efforts is covered more fully in lessons 3 and 4.
| Critical thinking: Identifying opportunities to use secondary data sources
Generally, primary data sources provide the most reliable and appropriate data for measuring the progress of your project. Primary data come from information collected directly by the project’s team and stakeholders. However, when possible, consider using secondary data sources as well. Secondary data come from information that is already available through other published or unpublished sources. The advantage of collecting data from secondary sources is that it is more cost effective and it reduces the risk of duplicating effort. Examples of secondary data sources include existing records, statistics and reports.
In practice, however, access to secondary data is often limited and it may be challenging to find data that directly address the precise needs of your project. If you choose to use secondary data, be clear about the criteria you use to confirm that the data are valid, reliable and directly represent your area of interest. For example, if you are using national data to measure poverty rates, you risk misrepresenting the actual rates of poverty in the communities in which you are working, or among the populations you are targeting. ● Have you ever used secondary data sources to report on your project indicators? ● Did you experience challenges related to the data’s appropriateness, timeliness or quality? ● Were you able to address these challenges? How?
|
Returning to the Delta River IDP Project, let’s explore how the UNITAS team has chosen to use mixed measurement methods to track the indicators related to Intermediate Result 2: “IDPs improve their handwashing practices.” Figure 25 identifies how the project will use a mixed-methods approach to monitor progress against the indicator for this IR.
| Objectives statement | Indicator | Measurement method | Type of information collected |
| Intermediate Result 2: “IDPs improve their hand washing practices. | By Year 3 of the project, 80% of IDPs self-report increased hand washing at critical times | Questionnaire (quantitative)
|
• Has hand washing behavior increased after critical events?
• Has knowledge of hand washing behavior increased? |
| Focus group(s) (qualitative) | • Which project activities were particularly effective at changing hand washing behavior?
• Are there factors preventing the target population from adopting hand washing behavior? • Is improved hand washing behavior resulting in valuable change? |
Balancing the cost and complexity of measurement methods Data collection activities are expensive and often consume a significant portion of a project’s MEAL budget. It is important to choose measurement methods that provide quality data, while weighing the trade-offs in terms of effort and cost. The graph below provides an illustration of some data measurement methods in terms of their relative cost and complexity.
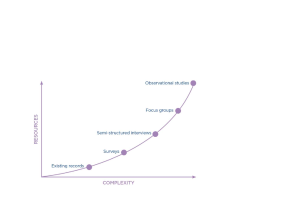
As you identify the measurement methods you will use to collect indicator data, you will need to weigh up the trade-offs between the quality and the cost and complexity of each option. Returning to the Delta River IDP Project, the UNITAS team needs to track the indicator that states: “By Year 3 of the project, 80 percent of IDPs self-report increased handwashing at critical times.”

When deciding which measurement methods to use, the team weighed two options for measuring handwashing frequency:
● An observational study in which data collectors would study IDP behavior at latrine locations, or ● A questionnaire in which IDPs would self-report their handwashing behavior.
Figure 26 identifies the trade-offs between the two options in terms of cost, complexity and quality of data. The team debated the advantages and disadvantages of each approach and documented their findings in Figure 27.
| Measurement method | Advantages | Disadvantages |
|
Direct observation |
● Data reliability: Direct observation is often considered the best way to reliably capture data.
● Richness of data: Observers can collect data on frequency of hand washing and the quality of hand washing. |
● Cost: Time-consuming
● Cost: More expensive ● Complexity: Skilled and validated observers required ● Quality of data: Direct observation risks influencing the hand washing behavior of latrine users. |
| Questionnaire | ● Cost: Less expensive
● Complexity: Fewer data collection skills required. |
● Quality of data: Self-reported data often overestimate true compliance. |
Based on the advantages and disadvantages listed above, the UNITAS team chose to measure frequency of handwashing using questionnaires.

While the team thought that the quality of data might be better if it used direct observation methods, the cost was prohibitive and the project lacked trained staff to conduct an observation study. The team had also received feedback from local partners indicating that placing observers near latrines would be culturally inappropriate. For that reason, their partners recommended that questionnaires were preferable.
|
Objectives statements
|
Indicators |
Measurement methods |
Assumptions |
|
|
Goal: Internally displaced people (IDPs) in the Delta River Region have improved livelihoods
|
||||
| Strategic objective:
There is reduced incidence of waterborne disease among IDPs |
● Incidence of waterborne disease among IDPs is reduced by 30 percent by the end of Year 3. | ● Municipal hospital and clinic records collected by mobile health teams | ||
| Intermediate result 1: IDPs have improved access to adequate water supply | ● By Year 3, 75 percent of IDPs indicate water access meets their household consumption needs
● By Year 3, 85 percent of IDP households are located no more than 500 meters from a water point. ● Each quarter, 100 percent of water points managed by community water boards meet WHO water quality standards ● By Year 3, an average of 30 liters of water per person per day is available to IDPs through water points |
● Questionnaire
● Focus group(s) ● Water point visits ● Quarterly water board reports. |
● Government meets its water system obligations
● IDPs do not obtain water from sources other than the designated water points |
|
| Intermediate Result 2: IDPs improve their hand washing practices. | ● By Year 3, 80 percent of IDPs self-report increased hand washing at critical times.
● Both soap and water are consistently present at latrine locations |
● Questionnaire
● Focus group(s) ● Latrine visits |
● No other sources of waterborne disease increase significantly ● IDPs sustain adoption of improved hygiene practices | |
| Output 1.1: Community water boards establish water points in IDP communities. | ● By Year 3, 40 water points are established (4 per village) ● By Year 3, 10 trained community water boards are operational ● By Year 3, 100 percent of water points meet water quality standards | ● Quarterly water board reports | ● Spare parts and trained mechanics are available in the event of water point breakdowns.
● Water points are established in locations that are safe and secure for women and children |
|
| Output 2.1: Volunteers improve knowledge of WASH principles. | ● 100 percent of WASH volunteers can effectively explain WASH principles to IDPs upon completion of training events.
● 40 WASH volunteers pass the certification exam each year |
● Training workshop attendance sheets
● Certification results |
● WASH volunteers are trusted by IDPs
|
|
|
Output 2.2: IDP communities increase knowledge of hand washing |
● By Year 3, 80 percent of IDPs demonstrate knowledge that hands need to be washed with soap after critical events.
● By Year 3, 75 percent of IDP women indicate higher levels of confidence preventing waterborne disease |
● Questionnaire
● Focus group(s) |
● IDP cultural and religious customs are not violated by the behavior change messages
|
|
| Activities IR 1:
1.1.1: UNITAS and water board identify new water point locations 1.1.2: UNITAS sources and distributes water point materials. 1.1.3: Community water boards identified, trained and functioning. 1.1.4: UNITAS team develops water board quality report format. |
| Activities IR 2:
2.1.1 UNITAS sanitation team identifies WASH volunteers and trainers. 2.1.2 Sanitation team designs WASH training curricula and materials, and identifies training locations and times. 2.1.3 Sanitation team delivers WASH training to volunteers. 2.1.4: Sanitation team develops handwashing campaign materials and mechanisms. 2.1.5: Community volunteers implement handwashing promotion events. |
Not a member yet? Register now
Are you a member? Login now