LESSON 3: Planning MEAL Activities
Introduction While logic models provide a helpful map for your MEAL activities, anyone who has taken a trip knows that a map is not enough. You need a more comprehensive and detailed plan that identifies when you leave, the precise route you will follow, the resources you need, and more. This chapter is organized into two sections that will support you as you plan for MEAL in your project.
Section A: MEAL planning tools: We introduce planning tools that help you develop a comprehensive, detailed and integrated plan for MEAL in your project.

Section B: MEAL in project management: We introduce best practices for including MEAL components in the larger project plan. These include suggestions on how to ensure MEAL is integrated into budgets, calendars and staffing plans.
| By the end of this lesson, you will be able to:
✓ Identify and describe the purpose, process and content of key MEAL planning tools. · Performance management plan. · Indicator Performance Tracking Table. · Feedback-and-response mechanism flowchart.
· Learning plan. · Planning tools for MEAL communications. · Summary evaluation table. · Evaluation terms of reference ✓ Understand the various types of evaluation and the purpose of each. ✓ Explain why MEAL planning is important and understand its relationship to broader project planning and project management. |
Section A: MEAL planning tools
When you receive the good news that your project has been approved, your project team will need to plan the concrete, comprehensive and detailed activities related to MEAL in your project. You will need to answer the question, “How will we collect, analyze, interpret, use and communicate MEAL information through the life of the project?”

This section of Chapter 3 introduces a number of MEAL planning tools that help you answer this question to create a functioning MEAL system.
The size and complexity of your project’s MEAL system—and the tools used to plan for MEAL—depend on a number of factors: How big the project is, its complexity, the risk inherent in its operating environment, the number of stakeholders involved, the budget you have to conduct MEAL activities, and the donor’s MEAL requirements, if any, with which you must comply?
If a project is relatively small and uncomplicated, planning for MEAL could be as simple as completing several tables. However, as a project increases in value and complexity, the complexity of your MEAL planning tools will also increase. MEAL planning tools help your project meet the information needs of all project stakeholders, including project team members, community members, project participants and donors.
| Planning tool | Content |
|
Performance management plan (or a monitoring and evaluation plan) |
Builds on the Logframe, providing additional information on indicator definitions, data collection plans, means of analysis, and data use. |
|
Indicator Performance |
Tracking Table Helps teams track progress toward a project’s indicator targets in an easy-to-read table format. |
| Feedback-and-response mechanism flowchart. | Maps the flow of feedback from stakeholders and identifies how the project will respond to the feedback it receives |
|
Learning plan.
|
Ensures learning activities are intentionally planned and managed throughout the life of the project.
|
| Planning tools for MEAL communications.
|
Identifies stakeholder information needs and helps ensure that MEAL communications are systematically planned and managed throughout the life of the project .
|
| Summary evaluation table | Describes planned evaluations, including priority questions, timing and budget.
|
|
Evaluation terms of reference |
Plans the specifics of an evaluation, including concise evaluation questions, proposed methods, and roles and responsibilities. |
3.1 Performance management plan
The primary tool used for detailed MEAL planning is the performance management plan (PMP), also referred to as the monitoring and evaluation plan. All projects should have a PMP regardless of their size, complexity or value. PMPs tell you specifically what will be monitored and evaluated, and how these activities will take place.

While PMPs vary in format, regardless of the template you use, your PMP should answer the following questions:
● How are the indicators defined?
● Who is responsible for MEAL activities?
● When will MEAL activities take place?
● How will data be analyzed?
● How will data be used?
The format of the PMP should be simple and clear. It is most often a table, into which is first inserted relevant information pulled directly from the project Logframe, and then completed as the team plans its work in detail. If necessary, written explanations can be added as accompaniments to the PMP table.
| Performance Management Plan | ||||||||
| Objectives statements | Indicators (with definations | Data Collection | Means of analysis | Use of information for communication and decision-making | ||||
| Method | Frequency | Person who will collect data | Respondents (who to talk to | Type of analysis | Subgroups (strata) | |||
| Strategic objective 1 | ||||||||
| Strategic objective 2 | ||||||||
| Intermediate result 1.1 | ||||||||
| Output 1.1 | ||||||||
| Output 2.1 | ||||||||
| Key assumptions | ||||||||
| Assumption 1… | ||||||||
| Assumption 2… | ||||||||
Note that the template above includes all the objectives statements from the Logframe as well as the assumptions. It is important that key assumptions are monitored during the project to check they are still valid. As mentioned previously, if evidence indicates that an assumption is invalid, you will need to explore options to redesign the project to address any resulting risks. Monitoring assumptions makes teams aware of these changes early enough to make project changes on time.

A more recent development across the aid community has been that some donors now require larger projects to include an annual reflection event during which the project’s logic models will be revisited, including the assumptions underpinning project success, to determine if any modifications are necessary.
Objective statements and indicators
The PMP uses the objectives statements and indicators pulled from the Logframe. However, the PMP does not usually include the goal or activities statements, for the same reasons the project Logframe does not include indicators for these statements: because it is unlikely your project will track progress against the goal or activities.

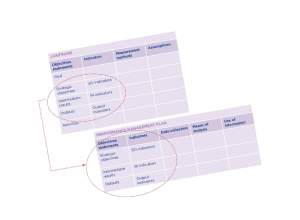
When completing a PMP, first copy the results statements into the template from the Logframe. Next, import the indicators from your Logframe. As you import your indicators, review each one to confirm that the indicator is clearly defined. For example, the UNITAS Logframe includes several indicators that need to be further defined in the PMP. The example PMP in Figure 31 includes a small amount of space for these definitions. In practice, it is preferable to add definitions as an attachment to the PMP. Some donors require specific templates to be used for this purpose, such as the Performance Indicator Reference Sheet, or PIRS, requested by USAID.
| Objectives statement | Logframe indicator | Indicator definition |
| IR 1: IDPs have improved access to adequate water supply | By Year 3, an average of 30 liters of water per person per day is available to IDPs through water points | The “30 liters of water per person per day” indicator is intended for domestic use only. Water use categories include:
• 10 liters for drinking • 10 liters for cooking • 10 liters for personal washing. The 30 liters is not intended to include water required for washing clothes, cleaning the home or growing food |
| Each quarter, 100 percent of water points managed by community water boards meet WHO water quality standards | The target for water quality should comply with national standards for the type and size of water point. Water quality is assessed by means of sanitary inspections and appropriate analytical measurements of total coliform and fecal coliform levels. | |
| IR 2: IDPs improve their hand washing practices. | By Year 3, 80 percent of IDPs self-report increased hand washing at critical times. | Critical times include before handling food and after using the toilet. |
Data collection: Methods, frequency, responsibility and respondents
The next step in the process is to complete the columns related to data collection.
● Methods: Measurement methods were identified when the Logframe was developed, so that information could be pulled directly into the PMP.
● Timing and frequency: You will now need to determine when and how often to collect data. The timing and frequency of data collection will be based on different factors, including:
○ Management and decision-making needs ○ Donor reporting requirements. ○ Seasonal considerations (this might include planting and harvest calendars, school schedules, weather patterns, and religious holidays) ○ Estimates of how quickly change is expected to occur. ○ Resource availability As you plan the timing and frequency of your data collection activities, it is also a good idea to think about how swiftly you expect change to occur. This will help you plan your data collection process strategically so that you can capture the change.
● Responsibility: Identify who is primarily responsible for collecting the data in question. As always, this allocation of responsibilities must be done in coordination with the general project implementation team and with any external stakeholders involved in the process.

● Respondents: Finally, identify and list your respondents. These are the people who can give you the most reliable data for each indicator. The PMP has space for a general statement of who you will interview to gather data for each indicator, such as “heads of households” or “women.” The more detailed process of identifying these respondents is called sampling, which requires the support of an experienced MEAL practitioner with statistical knowledge. This process is covered more fully in Chapter 4.
Means of analysis
The next step in the process is to complete the columns related to the means of analysis.
● Type of analysis: This section of the PMP table asks you to think clearly about how you will analyze the data you collect. Different types of data are analyzed differently. Quantitative data are analyzed statistically, calculating cumulative numbers, averages, percentages, etc. Depending on the complexity of your project, you may need to indicate in your PMP what level or kind of statistical analysis you will conduct for each indicator.
Qualitative data are analyzed using what is called “content analysis.” This is a process of reviewing notes from focus groups and interviews to develop themes. Your PMP should indicate this type of analysis when your measurement method is a qualitative method.
● Subgroups: As you plan your data analysis, determine whether your information needs require the comparison of data from different groups of people taking part in your project. When you identify these different groups, or “strata,” during your data collection design, you are then able to disaggregate the data each group gives you during analysis.

Disaggregation is the practice of dividing data collected from a population into groups according to key characteristics: gender, religion, age, etc. Disaggregation allows for the identification of trends, patterns or insights that would not be evident if the data was examined as a whole.
Disaggregation improves the utility of data by increasing the ability to make meaningful comparisons. When analyzing disaggregated data, there are three simple comparisons you can make that can significantly improve your ability to use the data.
● Comparing across subgroups: Disaggregation can reveal how results for one subgroup compare with other subgroups. ● Comparing with previous periods of performance: Disaggregation can reveal if the trend of results for a disaggregated subgroup is moving in the expected direction. ● Comparing with targets: Disaggregation enables the setting of targets specific to each disaggregated subgroup.
Which subgroups do you need and when do you disaggregate data as part of your analysis? The answers to these questions are determined by what you need to know. Start by examining your indicators. They will help you understand whether you need subgroups. Depending on the indicator, you might choose to break down your population into subgroups related to class, educational attainment, ethnic affiliation, or community location.

For example, one of the UNITAS indicators states: “By Year 3 of the project, 75 percent of IDPs indicate water access meets their household consumption needs.” The UNITAS team has decided that it needs to know more about the different kinds of households participating in the project and their different consumption needs. Thus, the subgroups incorporate household size, comparing data collected from large households (with 5 or more members) and small households (with 4 or fewer members.)
Decisions about subgroups must also be made with an understanding of the resources you have available for data collection and analysis. Adding subgroups to your collection and analysis plans can possibly double the time needed, given that you must ensure that you are completely representing each group in your data. Accordingly, these subgroups must be factored into the decisions you make about how to select the people from whom you collect data. Given the increase in resource requirements, make sure your subgroups are really needed to provide critical information, and that you are not collecting data that is simply “nice to know.”
Note that some teams, depending on the size and complexity of the project, choose to create a separate analysis plan. This plan goes into much greater detail than the PMP, specifying critical questions (including monitoring, evaluation and learning questions), all the subgroups they need to study, and any special reporting requirements. Alternatively, if the team chooses not to make a separate analysis plan, they may simply elaborate on analysis activities in an attachment to the PMP.
| Participation: Identifying respondents and subgroups?
Implementing partners and local contacts are often best-placed to identify the most appropriate respondents when collecting MEAL data. They are the ones that can answer questions like, “Are respondents hard to reach?”, “Do respondents provide as balanced, fair and accurate a perspective as possible on the indicators?”, “What characteristics describe the typical respondent?” These considerations impact decisions you will make later in the planning process. For example, when you design your data collection tools, you will need to know whether your respondents are literate enough to complete a survey without support. If not, you must think about a different way to collect data from those respondents. They are also a factor in your decision-making about analysis, the next section of the PMP.
Furthermore, the selection of subgroups you will compare should reflect an understanding of the local context and the people your project is seeking to support. Project stakeholders can be an invaluable resource to help the team determine what comparisons are important in the context of the project? Think of a time when you were challenged to identify the “right” respondents and subgroups to provide MEAL data. ● How would the process have been improved if you had involved community stakeholders? ● What would have been the best process to solicit community input? |
Data use Next, you complete the PMP table by adding details about how the collected data will be used. This section may be relatively straightforward if your project has simple needs regarding accountability and learning. In this case, the column can include simple statements such as “quarterly reporting,” or “evaluation report,” which meet your stakeholder information needs.
However, don’t limit your data use only to reporting. Be sure to include uses related to learning, management decision-making, and communications. Ask yourself how your data will be used to inform decisions in regular management or project monitoring meetings, and how it will be regularly communicated to communities and other stakeholders.
| Critical thinking: Using data flow maps to improve data use
When you begin a project, you make commitments to your stakeholders to report on certain indicators. These commitments define your information needs. By creating a data flow map, you identify the forms, collection processes and reports that will help you collect the data you need and meet your information-sharing commitments. Data flow maps illustrate the flow of data from each data collection form to the corresponding report. Visualization will engage your team in the process and help you find gaps in your system; places where you may need to create a new form or report. And, it can help you find efficiencies; places where you can use one form to complete two reports.
The design of your data flow map largely depends on the complexity of the project. A single map may be sufficient for representing all the data flow relationships of less complex projects. But a complex project may require a separate map for each of its components. To create a data flow map, follow these steps: 1. Identify all of your reporting requirements—internal and external—using the information in your PMP. 2. Document which indicators will be included in each report. 3. Map the data collection processes associated with each report, identifying which sources inform which reports. 4. Include who is responsible for data collection and reporting based on the information in your PMP. 5. Ensure that all reporting needs are met by the current data collection process and indicators, identifying opportunities to simplify the system where possible. It is possible that the process of creating your data flow map will generate ideas to update reporting and data collection processes. This is not a problem. Instead, you have demonstrated how the PMP should be a living document, something that is updated as your understanding of the project and your information needs changes and grows. |
3.2 Indicator Performance Tracking Table
Once your PMP is complete, the next challenge is to complete a tool that allows you to track the performance of your project by regularly documenting progress against project targets.
The Indicator Performance Tracking Table (IPTT) distills the project’s information into a short concise table format. It shows where the project stands with regard to its original and revised indicators, and shows progress achieved toward the indicator targets.11 The strength of the IPTT lies in its ability to:
● Provide a simple format to establish indicator targets and track progress against them over time
![]()
● Improve accountability for tracking and reporting project progress.
● Compare the project’s progress to other projects inside (or outside of) the organization.
● Compare actual versus expected performance and apply critical thinking to properly understand the evidence.
As with all MEAL tools, IPTTs can vary in format and content. Many donors require specific formats so that they can easily upload standardized information into their own analysis systems. Thus, it is important to comply with any donor requirements for your IPTT.
3.3 Feedback-and-response mechanism flowchart
Feedback-and-response mechanisms, or FRMs, create communication loops that enable teams to receive feedback from the project participants and to respond in a timely way to their suggestions and concerns. Feedback-and-response mechanisms are two-way communications mechanisms designed specifically to gather and respond to feedback from your project participants and other community stakeholders.

The key to a strong FRM is ensuring that communication is flowing in two directions:
● Feedback mechanisms Communities provide feedback to the project team through channels that include meetings, suggestion boxes, hotlines and others.
● Response mechanisms The project team acknowledges receipt of the feedback and provides appropriate responses to the community.
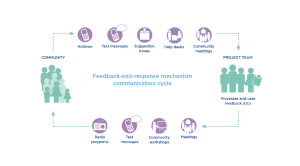
To better understand how to design an FRM system, it is helpful to review an example. Figure 37 is an FRM flowchart for the Delta River IDP Project. It shows how the project collects feedback using community suggestion boxes and community meetings. It then maps out how the information is processed and used, and then how the project responds to communities and individuals.
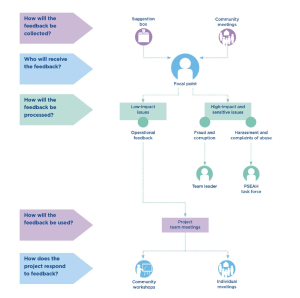
As you review the flowchart, notice that it explicitly answers five critical questions about the design of the Delta River IDP Project feedback-and-response mechanism system.
1. How will feedback be collected? The Delta River IDP Project uses two mechanisms to collect feedback: suggestion boxes and regularly scheduled community meetings.
When designing FRMs for your project, be sure to:
a. Consult with community members to identify collection mechanisms that are appropriate to your project context and effective at collecting useful feedback. b. Ensure that feedback shared informally during field visits is also documented. For example, if a community member shares feedback outside of the context of a community meeting, it still needs to be documented.
2. Who receives feedback? The Delta River IDP Project identifies a project team member who serves as a focal point for the FRM system. The focal point is responsible for managing the FRM process.
When designing FRMs for your project, be sure to:
a. Identify and train one person to be the FRM focal point. Make sure that they are a strong supporter of the process.
b. Ensure that the FRM focal point has FRM management included as an explicit responsibility in their job description.

3. How is feedback processed?
The Delta River IDP Project uses various procedures for processing FRM data, depending on whether the feedback is sensitive or not. For example, low-impact issues and general operational feedback are processed by the FRM focal point. However, sensitive issues are escalated to a higher level. Issues related to fraud and corruption are processed by the team leader, and any feedback related to harassment or sexual exploitation are escalated to the UNITAS leadership and managed by a preventing sexual exploitation, abuse and harassment (PSEAH) task force.
Document clear, formal and transparent internal procedures for processing feedback. Procedures should include guidance on which team members have the authority to act on feedback received and when. For example, the procedures should define which team members have the authority to respond to requests for information, investigate a complaint, refer a complaint, etc. The procedures should also include an appeals process for those who believe their complaint has not been appropriately handled.
When designing FRMs for your project, be sure to:
a. Identify and train the people responsible for processing different types of feedback. Note that the focal point dealing with low-impact issues will need one level of training while those processing high-impact, sensitive issues related to fraud, harassment and exploitation will need more advanced training.
b. Define how frequently feedback will be processed and by whom.
c. Identify where and how FRM data will be stored. An internal database should be created to help the team track feedback received and responses provided, and to monitor subsequent changes to the project.
d. Establish clear guidance on when and how to remove and destroy sensitive information to protect respondent privacy.
4. How is feedback used?
The UNITAS team intends to use feedback received from communities through the FRMs alongside monitoring data as part of ongoing project coordination and planning meetings. This data is used to analyze trends, disaggregate feedback by gender, check on how vulnerable groups are impacted by the project, and more.
5. How does the project respond to feedback?
Figure 37 maps out two response mechanisms that the Delta River IDP Project will use to respond to feedback. These include community workshops and meetings with individuals.
When designing FRMs for your project, be sure to:
a. Respond to all feedback received. In some cases, this will only require an acknowledgement of receipt, in other cases the response could be ongoing and complex.
b. Ensure that response mechanisms are appropriate to your project context and the type of feedback received. This is especially true when feedback relates to fraud, corruption, harassment or sexual exploitation. In those cases, it is critical that the rights of the stakeholders be respected with regard to due process, safety, anonymity and confidentiality.

c. Identify an appeals process in case you receive a second round of feedback from the community indicating that additional follow-up is required. Once the FRM design is complete and procedures are documented, create specific, clear instructions on how communities can access and use the FRM. The instructions should be shared with communities through orientation sessions and with staff through training events so that everyone understands the process and use of the FRM.
3.4 Learning plan
As defined in Chapter 1, learning in the context of MEAL is about having a culture that encourages intentional reflection and processes that support this culture. All teams learn as they implement project activities. But to take advantage of this learning and consistently translate it into improved practice for your project, your organization and your sector, learning must be planned and managed.
One of the reasons why learning is especially important in development and humanitarian relief projects is because frequently the work takes place in dynamic environments of instability and transition. Even in more stable contexts, conditions change and may affect programs in unpredictable ways. For projects to be effective, teams must be able to adapt in response to changing contexts and new information. The ability to adapt requires an environment that promotes intentional learning and flexible project design, minimizes the obstacles to modifying projects and creates incentives for adaptive management.
Adaptive management is an intentional approach to making decisions and adjustments to the project in response to new information and changes in context.13
While adaptive management focuses primarily on project learning, the information you generate from project MEAL systems can also be used to help the larger organization learn and change.
Organizational learning is the process by which an organization discovers and adapts to new knowledge. There are three concepts that contribute to organizational learning, all of which are intrinsically linked to your MEAL processes.

● Knowledge creation: New knowledge is created by combining new information (the data you are collecting through your MEAL processes) with existing knowledge, or by discovering new ways of organizing existing knowledge.
● Knowledge transfer: An organization doesn’t learn until knowledge is transferred agency wide. Knowledge transfer can be person-to-person and through knowledge platforms that are used to share information across programs, offices and locations.
● Knowledge retention: Organizational learning happens when new knowledge is embedded into processes and activities, at the project, organizational and sectoral levels.14 This is why the MEAL cycle is circular, to support a process of embedding learning into the work of the organization.
Project MEAL systems have the potential to be a foundational input into the organization’s learning strategy. The data collected, analyzed and communicated through your project are an invaluable input to inform organizational learning. However, for this to happen, you need to make connections between your project MEAL plans and the learning needs of the larger organization.
Questions to ask as you make these connections include:
● Are there learning questions that the organization is trying to answer as part of a larger organizational learning agenda that could be informed using evidence from our project?
● Are there standard organizational indicators that we need to include in our MEAL system design to ensure that our data are consistent and comparable to data from other projects?
● If so, are those activities in our project PMP, communications plan, and summary evaluation matrix?
| Critical thinking: Organizational learning agendas
Often the terms learning plan and learning agenda are used interchangeably. However, the two concepts have different meanings. A learning plan is focused on learning processes at the project level and how they might be supported by improvements in knowledge creation, capture, management and sharing. A learning agenda is a set of broad questions directly related to the work that an organization conducts that, when answered, enable the organization to work more effectively and efficiently. A learning agenda includes: 1. A set of questions addressing critical knowledge gaps. 2. A set of associated activities to answer them. 3. Products aimed at disseminating findings and designed with usage and application in mind.
● Do you work with an organization or donor that has a learning agenda? ● How do you align and integrate your MEAL systems to contribute to the larger learning agenda? |
Finally, project MEAL can also contribute to sectoral learning, i.e. learning within a particular subject area, or sector.
Traditionally, organizations have shared project learning with the sector through activities that include making evaluation reports available publicly; documenting best practices in cases studies and white papers; publishing academic papers; and presenting results and lessons learned at conferences.

More recently, with the advent of the internet, organizations share sectoral knowledge through a variety of digital platforms. For example:
● Practitioner networks can gather in online communities of practice to exchange the latest findings from research and practical experiences. (This guide encourages all project staff to join such online MEAL communities, for example, to keep abreast of the latest developments in MEAL.)
● Massive open online courses, or MOOCs, and open learning platforms increasingly provide advanced opportunities for learning and sharing at scale.
● Social media have become powerful conduits for knowledge sharing. Planning for learning means that you are intentional about how and when you will learn and contribute to sharing that learning across the organization and sector. As you do this planning, include investment in, and activities related to, the following four areas:
● A culture of learning
● Embedded learning processes
● The capacity of staff and partners to learn
● Sharing learning
Figure 38: Practical examples of how to plan for and invest in learning
|
A culture of learning |
● Promote an environment that encourages open, honest relationships and a commitment to continual learning and improvement.
● Create a safe space to constructively challenge assumptions. ● Identify and support critical thinkers and encourage their active participation in MEAL processes. ● Identify the specific learning attitudes, skills and knowledge that your project needs to promote continual learning. |
|
Embedded learning processes |
● Include “learning and reflection” as an agenda item for all MEAL team and project-related meetings. Your MEAL tools, such as the IPTT, are a good starting point for these discussions.
● Include learning prompts in regular monitoring tools designed as part of your MEAL data gathering system. ● Incorporate after action reviews, learning-to-action discussions and other learning events as part of key implementation activities |
|
The capacity of staff and partners to learn |
● Identify specific training activities for staff, partners and other stakeholders in basic principles and practices of learning and adaptive management.
● Ensure that staff are trained in facilitating intentional group learning processes. |
|
Sharing learning |
● Coordinate sharing activities with wider communications planning so that learning is included in meetings or conferences, published reports, or information-sharing tools that are appropriate to your context. |
| Critical thinking: Learning-to-action discussions
One way to practice adaptive management and plan for learning is to include learning-to-action discussions, or LADs, as part of project activities. Learning-to-action discussions are specifically planned discussions that bring staff together to reflect on data and understand project progress. They take place throughout the data collection process. When LADs are explicitly integrated into the MEAL system, project teams and their partners can proactively use MEAL data to understand how well the project is proceeding, to identify the factors enabling or inhibiting progress, and to inform decisions about future direction. Teams do not need to wait for a full sample of MEAL data to be collected before conducting a LAD. Ongoing checks are useful to spot early signals of opportunity or risk while they can still be addressed.
It can sometimes be difficult to introduce a culture of adaptive management into projects. At times, the project funding and donor environment can inhibit the kind of flexibility that may be needed. It can be challenging to negotiate changes to project deliverables, indicators, approaches and logic models. Furthermore, learning activities—and MEAL in general—can be viewed as an overhead expense that lacks resources in the project budget. While many donors are now recognizing the need to be more flexible in the way they work with implementing partners to design and fund projects, change in this regard will take some time to be fully realized. |
Documenting your plans for learning is critical to making sure learning happens. Documentation helps you turn good intentions into practical action. As with many of the tools described above, the tool you use to document your learning planning varies depending on your context (resources, requirements, etc.).
No matter what tool you use, your learning plan should include:
● Activity or process: A concise description of the specific activity or process.
● Roles and responsibilities: The roles and responsibilities of the office or staff member responsible for leading the activity or process.
● Expected outcomes: The intended outcome for each action item describing the anticipated changes resulting from implementing the identified activity or process.

● Timeline: The key milestones and deadlines for the activity or process. This timeline should be linked to project implementation calendars.
● Resources: The resources (including staff time, mechanisms, implementing partners, funding, etc.) needed to implement the action item. This planning should be completed in coordination with overall project planning to make sure these resources are made available.
| Activity or process | Responsible | Expected outcomes | Timeline | Resources |
| Improving the learning culture | ||||
|
|
||||
|
|
||||
| Embedding learning processes | ||||
|
|
||||
|
|
||||
| Investing in the capacity to learn | ||||
| Encouraging the sharing of learning | ||||
3.5 Planning tools for MEAL communications
Ideally, all projects will create a communications plan that serves as the principle tool for bringing greater intentionality to meeting stakeholder information needs.
Communication plan Defines who needs to be aware of and informed about the project MEAL activities, what they need to know, how and how often information will be distributed, and who will be responsible for the distribution.
Your communication with communities and partners should reflect the information needs of the audience you are trying to reach and the channels and formats tailored to their context.
The general contents of a communications plan should include the following information:
Target stakeholder, information needs, communications methods and timing. Target stakeholder: Who needs to receive MEAL communications? It is not unusual for a project to have many stakeholders, some more pivotal than others. Stakeholders have different information needs and different communication preferences. Each will require information provided in a way or ways that are appropriate to them.

Information needs What does each audience need to know? Good communication requires an understanding of the stakeholder and their information needs. Some examples of stakeholder information needs include:
● Project goals and objectives, including project targets and who will receive support ● Access to and use of feedback-and-response mechanisms. ● Project progress, changes and updates. ● Results of learning efforts
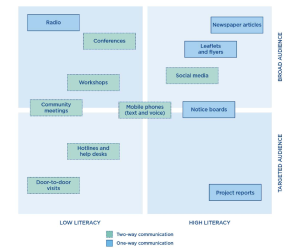
Communications methods: Information should be as accessible as possible. The most effective communications methods will be designed with the stakeholders’ preferences in mind. It can be very helpful to consider issues such as “What are the literacy levels and preferred language?” “Do stakeholders have access to technology?” “How broad an audience are we trying to reach?”
Don’t assume that a single communication method will work for all stakeholders. For example, your donor will require information through written reports. However, the format used for written donor reports will often be inappropriate for other audiences due to their language, length, level of detail, etc. So, be creative when identifying the best ways to communicate. For example, community members who cannot read or write will require information using diagrams at community meetings, whereas youth in the community may prefer to receive the same information in mobile text messages.

Figure 40 identifies possible communication methods, categorized by:
● Literacy requirements (low literacy/high literacy) ● Size of the audience (broad/targeted) ● Whether they promote one-way presentation of information, or two-way exchange of information.
Timing and frequency: All communications should be planned in accordance with the overall implementation team and calendar. This will allow for enough time to communicate effectively.
| Target stakeholder | Information needs | Communications methods | Timing and frequency |
|
Donor |
● Updates on progress against objectives and requirements identified in the donor contract.
● Donor update report |
● Evaluation report | Twice yearly (March and October) |
| Regional technical office | ● Share learning.
● Report progress against standardized WASH indicators. |
. ● WASH reporting template | Yearly (June) |
| Ministry of Health | ● Updates on progress against strategic objectives and intermediate results. | ● Quarterly meetings ● Information sheets | Quarterly (March, June, Sep, Dec) |
| Project team and implementing partners | ● Monthly updates on status of indicator performance. This information is used to monitor progress and inform decisions. | ● Indicator Performance Tracking Table
● Monthly meetings |
Monthly |
| IDPs | ● Project initiation information related to scope, targeting and exit strategy.
● Project MEAL updates related to progress against objectives, participation opportunities, and feedback-and-response mechanisms. ● Project close-out information |
● Community visits
● Community meetings and related materials |
Quarterly (Jan, Apr, Jul, Oct) |
| Host community members
|
● Information related to project goals and objectives.
● Project participant criteria |
Radio programs | Yearly |
As you review your communications plan, be sure that it addresses all of the stakeholders that need information from the project. The communications plan should not only focus on promoting accountability to funders and others in the organizational hierarchy (by generating reports and scheduling events), but also ensure that you are communicating in ways that promote accountability to communities, implementing partners and other stakeholders, by updating them on the progress of your project activities. Remember those who are at the center of what you do. It is important to communicate with stakeholders to ensure that your projects are:
● Transparent: Effective communication with communities ensures they have access to timely, accurate and relevant information in languages and formats and on relevant channels that are culturally appropriate and accessible to different groups.
● Participatory: Establishing and sustaining multiple inclusive channels for sustained dialogue strengthens the engagement of communities in programming.
● Responsive: Projects need to be responsive to the information needs of communities, partners and other stakeholders. Be sure to consult with your primary users and stakeholders to determine when and in what form they want to receive information.
3.6 Evaluation planning
All projects should include some sort of evaluation activity. Small projects may choose a very light, simple evaluation. Other projects—especially large, multi-year initiatives—commit to conducting more complex evaluations in addition to the regular monitoring activities identified in the PMP. Projects that do not include a formal evaluation should, at minimum, plan for an after action review.
Evaluations are complex and can be both time-consuming and costly. Thus, planning is essential to make sure you are using your resources wisely while meeting your information needs. The type of evaluation you do and the timing of your evaluation(s) will be dictated by your information needs and the related evaluation questions you identify.
Figure 42 identifies evaluation types according to when they occur during the project cycle.
| Type | Purpose | Timing |
|
Formative |
Improve and refine an existing project. |
Early in project implementation, up to the midpoint. |
|
Process. |
Understand how well a project is being implemented (or was implemented) particularly if you want to replicate or enlarge your response. | During project implementation (often at the midpoint) or at the end |
|
Impact or outcome |
Assess how well a project met its goal to produce change. Impact evaluations can use rigorous data collection and analysis, and control groups. | At project end. Also requires baseline data gathered at the beginning of implementation and regular, rigorous monitoring activities. |
|
Summative |
Judge the performance of the project. |
At project end.
|
|
Ex-post |
Assess the long-term sustainability of the project. | After the project’s formal end date, sometimes 3 to 5 years later. |
|
Developmental evaluation |
Used to design a response to a known need, particularly in complex situations, where response approaches are being tested. It supports creative, innovative approaches and provides real-time feedback to inform ongoing project design. | Continually throughout project implementation. |
|
Empowerment evaluation |
An approach that seeks to improve project implementation by providing project participants themselves with the tools to evaluate the planning, design and implementation of the project. | Throughout project implementation in the sense that participants require training and facilitation in evaluation tools. The evaluation becomes part of project implementation |
|
Meta evaluation |
A systematic and formal evaluation of evaluations. Examines the methods used within an evaluation or set of evaluations to bolster the credibility of findings. Often used in policy-making settings. | External to project implementation cycle. |
Note that the data collection methods used in each type of evaluation vary. Some evaluation types rely more on quantitative data while others rely more on qualitative data. The gold standard for selecting methods is to choose the most appropriate method to meet the objectives of the evaluation. Many evaluations use a mix of methods to gather the information needed to answer the relevant questions.

Summary evaluation table Once you are clear about the type(s) of evaluation you will conduct, you can begin filling out the summary evaluation table, or SET. The table should be completed at the beginning of your project and begins to build out the details of the evaluations your project intends to conduct. The table uses a template similar to the one found in Figure 43.
| Evaluation purpose (performance, impact, etc.) |
Priority evaluation questions |
Timing (midterm, final, etc.) |
Anticipated evaluation start and completion |
Evaluation budget | |
| Start | End | ||||
You begin completing the table by identifying the types of evaluation you intend to conduct and the purpose of the evaluation. For larger projects, there might be multiple evaluations.
Next, you need to identify the priority evaluation questions that your evaluation(s) will answer. A preliminary step when identifying evaluation questions is establishing your evaluation criteria.
Evaluation criteria are a set of principles that guide the development of evaluation questions and the overall evaluation planning process.
Some of the most commonly used evaluation criteria come from the Organization for Economic Cooperation and Development (OECD). They include:

Relevance: The extent to which the project is relevant to the priorities, needs and opportunities of the target group, recipient and donor. Efficiency: The extent to which the project uses the least costly resources possible to achieve the desired results. This generally requires comparing alternative approaches to achieving the same outputs, to see whether the most efficient process has been adopted. Effectiveness: The extent to which a project attains its objectives. Impact: The positive and negative changes produced by a development intervention, directly or indirectly, intended or unintended. Sustainability: The extent to which the benefits of a project are likely to continue after support (monetary and non-monetary) has been withdrawn.
If your donor has requested a certain type of evaluation and included related funding, then you will need to consider those requirements as you establish your evaluation criteria.
Once you have identified your evaluation criteria, you will need to identify the concrete evaluation questions that drive your evaluation.
Evaluation questions are clear statements of what you need to know from the evaluation. The questions you ask will vary depending on the evaluation criteria you explore. Figure 44 provides examples of evaluation questions by OECD/DAC criteria area.
| Criterion | Illustrative question |
|
Relevance |
● Did the initial needs assessment identify priority community needs?
● Did the assessment differentiate between the needs of men and women, and between more vulnerable and less vulnerable households? If so, how? If not, why not? ● Has the project met the specific needs and priorities of women? Why or why not? ● Is the project design appropriate for meeting the community’s priority needs? ● Did the targeting strategy allow the project to meet the greatest need in the community (i.e., the most vulnerable households or individuals)? Why or why not? ● Was community participation sufficient throughout the needs assessment, design, implementation, and monitoring and evaluation of the project? Why or why not? If not, how can participation be increased during the remainder of the project (for midterm evaluations) or in a future project (for final evaluations)? |
|
Efficiency |
● Did the project achieve its planned outputs (according to the detailed implementation plan) on the planned timeline? Why or why not?
● Did the monitoring and evaluation system provide the right information at the right time to allow for timely project management and decision-making? Why or why not? ● Has working in partnership increased the effectiveness and quality of the project? Why or why not? ● Has the project been effective in building partner capacity? If so, how has partner capacity been built? If not, why not? If not, how can this be improved for next time? |
| Effectiveness
|
● Are the project‘s staffing and management structures efficient? Why or why not? ● Did the project staff have enough capacity to implement a high-quality project? Why or why not? ● What was the cost per project participant? Is this reasonable given project impact? Why or why not? |
|
Impact |
● Has the project achieved its planned impact (refer to Logframe indicators to determine planned impact)? Why or why not?
● Did impact vary for different targeted areas, households or individuals (e.g., men and women)? If so, how and why? ● Was there any unintended impact from the project, either positive or negative? What impact was most valuable to participating communities? Why? |
|
Sustainability |
● What is the likelihood that the community will be able to sustain the impact of the project? How do you know? ● What has the project done to support community structures or groups to be able to continue to address community needs and sustain project impact? Is this sufficient? |
Once you are clear on the type(s) of evaluation and the evaluation criteria, you can provide high-level estimates of the evaluation calendar and evaluation budget.
Evaluation terms of reference The evaluation terms of reference, or ToR, is a planning tool that is developed directly before the evaluation is conducted. It is much more detailed than the summary evaluation table and becomes a planning document for the evaluation itself. If your project intends to conduct multiple evaluations, a separate ToR will be needed for each evaluation.
As your evaluation approaches, those tasked with managing the evaluation(s) should allow plenty of time to collaboratively complete the ToR. Collaboration is important because it helps ensure that all stakeholders’ information needs are addressed by the evaluation. And, it is an opportunity to clarify and agree on stakeholder expectations regarding data collection, analysis and use. If expectations are not clearly understood, you may find that your evaluation sits in a drawer because it did not meet stakeholder expectations in terms of design, implementation or decision-making.
Collaboration with the wider project team is also helpful because it allows you to ensure that the project budget and calendar include the time and resources you will need to conduct your evaluation.
Terms of reference are important whether you plan to hire an external evaluator or use an internal evaluation team. The ToR clearly explains the project, your evaluation purpose, evaluation questions, and the methods you suggest for collecting data to answer those questions. It can be a useful management tool, both internally and externally.
An evaluation ToR should include the following information:
Project introduction and background: Briefly describe the project, its implementation period, funding sources and amounts, and any other relevant information. Summarize the project, the problem that it seeks to solve, and its intervention strategy. Also include a description of what baseline and monitoring data already exist.
Evaluation purpose, audience and use: This is an extremely important section. It explains why you are conducting the evaluation, who will be using it (internally and externally) and how it will be used. Being clear and specific in this section increases the chances that your evaluation results (and any reports you generate) will be relevant and timely to your internal and external stakeholders. To create this section, review your communications planning tools to refresh your understanding of your stakeholder information needs. Then, consider how you can present evaluation results to those stakeholders using methods appropriate to each.

Evaluation criteria and questions: Review the evaluation criteria and questions that were originally included in the summary evaluation table. It is likely that the questions will need to be updated based on your experience, monitoring results and implementation challenges. Be realistic about the number of questions you include in your evaluation ToR. Include only the questions that you need to answer and that can be realistically answered within the timeframe and budget available to you. Your MEAL specialists and stakeholders can help you narrow down the list.
Methodological approach: Many ToRs include a basic description of a suggested approach that incorporates the monitoring processes and data already in place and suggests supplemental ideas. If your donor has requested a certain type of evaluation and included related funding, then you will need to specify those requirements here. If you’re using the TOR to hire an external consultant, you may want to request that they suggest methods with which they are experienced. Any methods chosen must be linked to the questions that need to be answered. It is likely that a variety of methods will be needed to meet information needs, resulting in the mixed-methods evaluation that is often recommended. Finally, include a section about how you expect data to be analyzed (this information can partially come from your PMP).
Evaluation roles and responsibilities: Describe the various roles and responsibilities of the evaluation team. Describe how a potential external evaluator or evaluation team will communicate with the project and MEAL teams. Also, be sure to include detail about data collection, data analysis and report-production responsibilities.
It is useful at this stage to be specific about how you expect partners and local stakeholders to be involved in the evaluation. Stakeholder involvement in the evaluation process itself enables them to own the findings, thereby increasing the chances of high-quality data and follow-up.
Evaluation deliverables and timeline: State specifically the timeline of the evaluation and when different components are due. Plan time for document desk review, fieldwork, data analysis, and report writing. Be sure to include time for stakeholder feedback and response.
Evaluation logistics and other support: Include details about logistics and support to the evaluation team. Indicate whether support will be forthcoming from local partners, particularly in terms of data gathering. If necessary, allow extra time when conducting more complicated evaluations to design samples, and finalize databases and data entry plans.

Section B: MEAL in project management
As your team plans for MEAL, it is critical that these plans are aligned with, and embedded into, the larger project’s budget, timeline and staffing requirements. When MEAL activities are overlooked during the creation of wider project management plans, any number of issues can result, including inadequate budget and staff resources to conduct MEAL activities, and scheduling conflicts between MEAL activities and other project implementation activities.
The most important input when developing budgets and calendars for MEAL is a comprehensive and detailed list of project MEAL activities. If you have completed the planning tools in Section A of this chapter, you will have already identified many of these activities. The performance management plan and the summary evaluation table will be especially helpful; however, other documents like the learning plan and the communications plan will also be important to consult.
3.7 MEAL in the project calendar
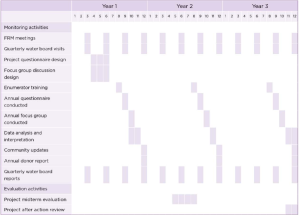
When developing the calendar for MEAL activities, the MEAL team should list all the MEAL activities included in the planning documents. The list should include all monitoring visits, evaluation activities, learning initiatives, feedback-and-response mechanisms, communications efforts, and any reports that need to be created. Working from this information, build a Gantt chart specifically for project MEAL activities.

Gantt chart A bar chart that illustrates a project schedule, identifying the start date, end date and expected durations of all activities. It is especially important that the project team works collaboratively with other stakeholders as they develop the MEAL Gantt chart. Using a participatory approach to scheduling helps identify opportunities for scheduling efficiencies, and reduces the risk of scheduling conflicts between MEAL activities and other project implementation activities.
Figure 45 shows an example Gantt chart for the first 3 years of MEAL activities for the Delta River IDP Project. The Gantt chart includes both the monitoring and evaluation activities for the project. This list of activities is pulled from the performance management plan, the summary evaluation table and the communications plan for the project. Activities listed in those documents include feedback-and-response mechanism meetings, quarterly water board visits, annual focus group discussions, annual questionnaires, a midterm evaluation and an after action review.
3.8 MEAL in the project budget
Budgeting for MEAL is usually an iterative process. The initial step toward establishing the MEAL budget takes place when the original project proposal is developed. This original budget is a high-level estimate of costs based on initial estimates of the MEAL activities that will be conducted.
After the proposal is approved, a more detailed budget needs to be created. Detailed budgets are often activity-based. This means that the project creates accurate and complete budget estimates by systematically listing, quantifying and costing out all the resources (e.g. staffing, materials, equipment and travel) that are needed to run the MEAL activities for the project.

These MEAL activities are found in the MEAL planning documents and the MEAL Gantt chart. It is important to consult with the budget and human resources offices within your organization to verify and understand your particular budget process, rules and policies. Similarly, review any donor requirements and regulations related to project MEAL.
The Delta River IDP Project MEAL budget is based on the activities listed in the project Gantt chart. The budget template is activity-based, providing budget estimates for the monitoring activities, midterm evaluation activities and the after action review activities listed in the project Gantt chart.
As you review the Delta River IDP Project budget, notice that the team has categorized the expenses for each of the MEAL activities areas into three cost categories: staffing, travel, and materials and supplies. Staffing is by far the largest cost category. When it comes to estimating staff requirements for MEAL, your staffing needs will depend on the size and complexity of your project, your MEAL system, and the budget you have available.

| Critical thinking: Staffing for MEAL
When budgeting for MEAL, clearly identify your MEAL staffing strategy so that your budget estimates are accurate and comprehensive. Ask the following questions as you develop the MEAL staffing strategy: ● Do we intend to hire MEAL specialists that are primarily responsible for implementing our project MEAL activities? ● Will we share responsibility for MEAL activities among and between multiple project team members. ● Will our project require the support of MEAL technical advisors on an occasional basis to support critical MEAL activities? ● Do we need enumerators, survey facilitators and other staff to conduct surveys, questionnaires, focus group discussions and other MEAL data collection tools? ● Do we intend to hire an external, independent consultant or company to conduct evaluation activities? |
Finally, notice that the section of the budget entitled monitoring activities includes a cost category entitled equipment. Be sure to include expenses related to information and communications technology (ICT) in the equipment category.

For example, the Delta River IDP Project intends to buy special computer-assisted qualitative data analysis software (CAQDAS) to analyze data collected during focus group discussions, as well as handheld devices for questionnaire enumerators, so that data can be recorded directly in a digital format. And, don’t forget that new ICT investments will require the training of staff, so a training line item has been included in the staffing category for that purpose
Not a member yet? Register now
Are you a member? Login now