
LESSON 4. Collecting MEAL data
Now that your MEAL planning process is complete, the next step is to get started with collecting data. Timely, high-quality data are the foundation upon which project teams can measure progress, make decisions and learn.
Data quality is an important consideration for all MEAL practitioners, so much so that standards exist to define various characteristics of high-quality data. These are described in detail below.

Then, this chapter focuses on four areas that influence your ability to collect high-quality data: developing good data collection tools, defining from whom data will be collected (otherwise known as sampling methods), correctly using data collection tools, and, finally, managing the data you collect properly.
| By the end of this chapter, you will be able to:
✓ Explain the five elements of data quality. ✓ Describe the components of a basic data collection tool outline. ✓ Identify three primary methods of data collection and key characteristics of each (questionnaires, interviews and focus group discussions) ✓ Explain the basic principles of sampling ✓ Describe key steps in preparing to implement data collection tools ✓ Identify generally accepted protocols and standards for responsible data management ✓ Understand the basics of selecting databases and associated data entry and cleaning practices |
4.1 Data quality
The data you collect will never be free of bias. Thus, you need to determine, with the help of your stakeholders, what quality and quantity of data is “good enough” for your decision-making, learning and accountability needs. As you begin to think about collecting MEAL data, it is useful to consider the following five data quality standards.

Validity Data are valid when they accurately represent what you intend to measure. In other words, the data you collect helps you measure the indicators you have chosen. When designing your collection methods, make sure they will collect data that will help you measure the indicators outlined in your PMP. Also, the mix of collection methods should meet your needs for triangulation.
Reliability Data are reliable when the collection methods used are stable and consistent. Reliable data are collected by using tools such as questionnaires that can be implemented in the same way multiple times. In practice, this means that if you use the same questionnaire to ask the same person the same questions and nothing else has changed, you should get the same answer. Consider this factor when you are designing your discussion guides and questionnaires for focus groups and interviews.
Precision Data are precise when they have a level of detail that gives you an accurate picture of what is happening and enables you to make good decisions. For example, precise data allow you to compare results between men and women, if this is important for your project. When designing your data collection tools, make sure any subgroups you have identified are incorporated into the design. Accordingly, precise data are collected using appropriate sampling methods, which are described in detail below.
Integrity Data have integrity when they are accurate. Data should be free of the kinds of errors that occur, consciously or unconsciously, when people collect and manage data. Errors can enter your data when, for example, the questionnaire is implemented incorrectly or the data are not properly entered into the database. Following the guidance outlined below on the design and implementation of collection tools and the management of the data you collect will increase the integrity of your data.

Timeliness Timely data should be available when you need it for learning that informs decisions and for communication purposes. Data are not useful to you when they arrive too late to inform these processes. This factor plays a significant role in your planning for data collection, which is the reason for the column in the PMP on timing. Design your data collection efforts to coincide with when you need to make decisions, and report to stakeholders. Timeliness should also be factored into the design and implementation of your tools. You want to make sure that your design is as efficient as possible and only collects the data that you absolutely must collect.
4.2 Developing data collection tools
As you begin developing your data collection tools, it is a good idea to revisit the question, “What do I need to know?” The good news is that much of what you need to answer this question has been clearly mapped out by the indicators found in the PMP and, if you are conducting an evaluation, the evaluation questions found in the summary evaluation table and the terms of reference. Your design of the tools and your sampling process will depend on your answer to this question.
This section explores three of the tools most frequently used to collect quantitative and qualitative data: questionnaires, semi-structured interviews and focus group discussions.

Before we describe these tools in detail, it is useful to understand that all tools, whether it is a questionnaire, or a discussion guide used to facilitate a focus group discussion or interview, are designed using a similar outline. Walking through this outline helps illustrate good practice for designing data gathering tools:
Section 1: Introduction
The introduction to your tool gives you the chance to explain the project and the data collection process to the respondent. This overview should explain:
● Why information is being collected ● How participants were identified. ● How the data will be collected. ● How much time the data collection will take ● How the data will be used. ● Who will have access to the data.
Of particular importance in the introduction is an explanation of the ethical principles that guide your data collection efforts. Accordingly, all tools should explain:

● The principle of informed consent: Participants understand the above points AND understand that their participation is always voluntary. Respondents can leave or stop at any time. Remember that children and some adults may be unable to provide legal consent. In these cases, you might be required to obtain the consent of the parent or legal guardian and the assent of the subject.
● Specific plans to keep participant contributions confidential and, if needed, anonymous.
● Plans, if any, for compensation for participation.
● Plans to share results with participants.
Section 2: Questions
After the introduction, your tool lists the questions to be asked of the respondent that are designed to gather the data you need to meet your information requirements. The specific design of questions is dependent on the type of tool you are using and is described below. But, there are several general design practices that it is useful to highlight here.

Overall, it is helpful to invest time in the layout and design of your data collection tool. When a tool has a professional look and feel (layout, style, graphics), it is not only easier to use, but also motivates those administering it. Additionally:
● Ensure that the language you use in your questions is simple, clear and free of jargon. This will help you collect data in a way that is appropriate to your context and your participants.
● Organize questions using a clear, orderly sequence. The structure of questions asked should be logical and make sense to data collectors and participants. It is recommended that tools begin with simple questions and then move to more challenging and sensitive questions later.
● Make sure that your data collection tool includes fields to record important data analysis and management information such as: ○ The date and location of the data collection.
○ Participant identification (or coded pseudonyms), geographic area, community, gender, etc. This is particularly important if you intend to disaggregate your data by subgroups.
○ If needed, assign each data field a number and/or response code that can be used to facilitate analysis.

Section 3: Conclusion
All tools should close by offering the respondent a chance to ask questions and provide feedback on the experience. Always thank participants for their time and reiterate how the data will be used and when respondents might be able to hear the results of the data collection effort.
Quantitative data collection tools: Questionnaires Frequently, quantitative data is collected using a questionnaire.
Questionnaire A structured set of questions designed to elicit specific information from respondents.
High-quality questionnaires collect precisely the information that you need. Furthermore, as you develop questionnaires, try to identify opportunities to collect data on multiple PMP indicators using a single questionnaire. By designing questionnaires to collect data on multiple indicators, the team not only saves money (and simplifies logistics), but it is also respecting the valuable time of project participants. The project participants have busy lives and many responsibilities, so it is critical to look for ways to collect the information you need through as few instruments as possible so that you are not repeatedly asking that they commit time to provide MEAL data.

Consistent implementation is key to a successful questionnaire: the same questions are asked of each respondent, in the same format and order. This helps ensure that responses are clear, valid and reliable. Because questionnaires collect data that you expect to analyze statistically, they use primarily closed-ended questions that generate responses that are easy to code and analyze.
Closed-ended questions are questions that provide a predefined list of answer options. This makes it easier for responses to be coded numerically allowing for statistical analysis.
Figure 47: Types of closed-ended questions
| Question Type | Example | |
| Question | Response example | |
| Numerical 1. | 1. “How long have you been displaced?” | ____ Number of months, or
❏ I don’t know. |
| Two-option Response | 2. “Are there handwashing facilities at the latrine?”
If no, skip Question 3 below. |
❏ Yes
❏ No |
| Multiple choice | 3. “Which handwashing resources are currently available at the latrine?” | ❏ Water and soap
❏ Water only ❏ Soap ❏ Neither water nor soap ❏ Other____________________ ❏ I don’t know
|
| Rating or Likert scale | 4. Indicate the extent to which you agree with this statement: “My household has enough water to meet our household consumption needs.” | ❏ Strongly disagree.
❏ Disagree. ❏ Neither agree nor disagree ❏ Agree ❏ Strongly agree |
When designing questionnaires, consider the following guidelines:
● Questionnaires include “skip logic,” which allows respondents to skip a question based on their answer to a previous question. For example, in Figure 47, Question 2 asks “Are there handwashing facilities at the latrine?” If the respondent replies “No,” then they should skip the next question, “Which handwashing resources are currently available at the latrine?”
● Questions include the option to answer “I don’t know,” as appropriate.
● Questions include all appropriate responses. These responses should be exhaustive, should be very different from each other and shouldn’t overlap.
● In many cases, it is not feasible to include every possible category of response, in which case an “Other” category, with a space for the respondent to fill in a more specific response, is a good solution. See Question 3 above for an example of the use of “Other.”
Another fundamental choice related to designing questionnaires is around which media will be used to present them to respondents and how responses will be recorded. Traditionally, questionnaires were paper-based, with the respondent or interviewer completing answers in pen. Today, questionnaires are often administered digitally using one of the many online survey tools. When choosing the media you will use to implement your questionnaire, consider your target population and local logistics, the characteristics of the potential respondents, the types of questions you plan to include, the topic, the desired response rate, and the cost/time needed to collect the data.

The following chart describes the advantages and disadvantages of methods of questionnaire delivery.
| Delivery mode | Advantages | Disadvantages | Requirements |
| Personal interview | ● Respondents don’t need to be literate.
● Facilitators can motivate and support respondents. ● There is a high rate of cooperation and a low rate of refusal |
● Activities are time-consuming and expensive.
● Facilitators can influence respondents’ interpretation of questions (and their responses) ● Data entry can be difficult if responses are not collected using digital devices |
● Space and privacy for interviews
● Budget for travel ● Trained facilitators |
| Self-administered questionnaires (online or offline) | ● Easy and cheap to distribute.
● Access to a broader population in a larger geographic area. |
● Requires respondent literacy.
● Data input can be cumbersome if responses are not collected using digital devices. ● Potentially low response rates. |
● Logistics for distributing and collecting questionnaires.
● Budget for distribution and collection of questionnaires |
Qualitative data collection tools: Semi-structured interviews and focus group discussions
Qualitative data collection tools are designed to explore and understand the rich depth and context of the respondent’s perspectives, opinions and ideas. While questionnaires are highly structured and scripted, semi-structured interviews and focus group discussions more closely resemble a conversation.
Semi-structured interview A guided discussion between an interviewer and a single respondent designed to explore and understand the rich depth and context of the respondent’s perspectives, opinions and ideas.
Focus group discussion A guided discussion between respondents in a group. It is a qualitative data collection tool designed to explore and understand the rich depth and context of a group’s perspectives, opinions and ideas.

Unlike an interview with a single respondent, a focus group discussion provides an opportunity for a small group of participants to interact with each other, build on ideas and present divergent perspectives. However, while the exchange between group participants provides rich insights, a focus group discussion requires more experience to facilitate. As well as an experienced facilitator, they require a notetaker. Typically, a focus group includes 8 to 12 participants.
For focus group discussions, it is crucial to recruit the right participants. Once you have narrowed down the topics and questions, you’ll have a better understanding of who should participate in the discussion. Choose participants who can speak directly to the perspectives or experiences that you are interested in knowing about. When participants speak about personal perspectives and experiences, there is an increased likelihood of lively discussion, which leads to richer information and more reliable data. Also, identify focus group participants with a shared characteristic or experience so the discussion doesn’t become an unfocused brainstorm.

Whether or not you are designing a semi-structured interview or a focus group discussion, the key to strong qualitative data collection is to carefully plan the questions that will frame the conversation. These planned questions are prepared ahead of time, carefully scripted, and documented in an interview or discussion guide. Unlike the closed-ended questions used in questionnaires, most of the questions in the guides are open-ended.
Open-ended questions are those that allow someone to give a free-form response in their own words. There are two types of open-ended questions:
Content-mapping questions are also known as opening questions. These are intended to initiate the exploration of a topic by raising and broadly exploring an issue.
In order to encourage the rich discussion or responses desired by qualitative data collection, facilitators often follow content-mapping questions with content-mining questions.
Content-mining questions are also known as probing questions. These are follow-up questions that elicit more detail or explanation about a response to a content-mapping question.

Unlike content-mapping questions, content-mining questions are unscripted and free-form. Facilitators must have the skills and flexibility to adapt the flow of the conversation and ask the right content-mining questions. Content-mining questions enable the facilitator to explore a topic more deeply and investigate unanticipated topics.
Let us return to the UNITAS example to explore these two types of questions. UNITAS will be conducting focus group discussions to understand IDP access to potable water. The focus group discussion guide includes this content-mapping question: “What are the major barriers IDPs face when accessing potable water?” It is expected that some responses will require follow-up, so content-mining questions will be useful. For example, if the facilitator receives a response indicating that IDPs don’t always feel safe accessing water points, potential content-mining questions might include, “Can you tell me more about why you said, ‘I don’t feel safe?’” and “Can you provide an example?”
Note that content-mining questions are completely unstructured. Often you can anticipate potential content-mining questions and they can be documented as possible follow-up questions in the discussion guide.
4.3 Creating samples
Appropriate sampling methods collect the right amount of data from the right respondents to meet your information needs.

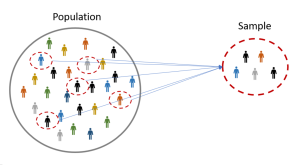
Sample A subset of the population or community that you choose to study that will help you understand the population or community as a whole.
Sampling is necessary because gathering data is expensive and time-consuming, making it difficult to speak to everyone. This is why you need to identify a sample group of respondents who will give you valid, reliable and generalizable information.
Sampling can be divided into two basic types: random sampling and purposive sampling.
Random sampling
Random sampling is used when you plan to use quantitative methods and analysis. This sampling approach is used when you need confidence that what is true for your sample is likely true for the entire population (or a subgroup of the larger population).
Random sampling is a probability sample that includes respondents selected from a list of the entire population of interest so that each respondent has an equal chance of being selected.
Random samples are created using mathematical calculations to identify how many people will participate in your data gathering efforts. These calculations are developed based on how strong you need your analysis results to be and how varied the population is. With this structure and rigor, they are thus determined to be statistically representative of a survey population or a subgroup of that population. This means that the results of the data can be generalized to represent the larger population.
In Chapter 3, we discussed the importance of collecting quality data that are valid, reliable, precise and generalizable. One way to promote this goal is to take steps to avoid sampling bias in your data collection activities.
Sampling bias occurs when some members of the population are more or less likely to be selected for participation in your data gathering efforts than others.
When your sample is biased, you are not taking into consideration all the available perspectives, ideas and opinions. This means that your data will not be as valid (accurate) and cannot be easily generalized to the population you want to address.
Generalization is possible when data gathered from a sample accurately represent the general population from which the sample was drawn.
For example, if you are studying the effects of establishing new community-based water points on the incidence of waterborne disease among families, your data will be less valid and generalizable if you only complete questionnaires among men. This is because women are more likely to be responsible for many of the household activities that require access to water.

Furthermore, if you only collect data from men, any findings and recommendations made from that data may not be valid for the entire community. Thus, you need to design your sampling method in a way that reduces sampling bias by giving all those who require access to water—both women and men—an equal chance of participating in your data collection efforts.
When working to reduce sampling bias, pay close attention to two specific types of bias that can be especially problematic.
● Convenience sampling bias occurs when data are collected from respondents who are easy to reach, or who are easy to work with. Data that suffer from convenience sampling bias could run the risk of over-representing people located closer to main roads, or groups that are fluent in the predominant language.
● Voluntary response bias occurs when data are collected disproportionately from self-selected volunteers. Data that suffer from voluntary response bias, could run the risk of under-representing people with busy schedules or people who travel frequently, and over-representing people with strong opinions or specific agendas related to the project.

After you have considered all these factors, steps to identify a random sample include:
Step 1: Defining your population and the sampling unit
Population :A set of similar people, items or events that is of interest for some question or experiment.
When defining your population, clearly articulate your inclusion and exclusion criteria. These criteria can include, for example, participation in project activities, geographic boundaries, or demographic characteristics. Inclusion or exclusion criteria are important decisions you make in deciding whether a particular group or geographic area should be included in a data collection activity.
Once you are clear on your population, you need to clearly identify your sampling unit.
Sampling unit: The individual person, category of people, or object from whom/which the measurement (observation) is taken. Examples of sampling units might include children under 5 years of age, adolescents, women, men, households, etc.

Step 2: Choosing a method to calculate your random sample
Once you have identified your population and your sampling unit, you are ready to start calculating your random sample. There are different random sampling methods that can be used to calculate the sample.
| Random sampling method |
Description |
| Simple random sample | Every unit in your population has an equal chance of being selected |
| Systematic sample | A process of listing and numbering all potential subjects and then selecting every 10th person, for example, until you have reached your sample size |
| Cluster sampling | The population is divided into naturally occurring clusters such as geographical areas, schools or places of employment. All the clusters are listed, and a sample of clusters is randomly selected. In some cases, all subjects in the cluster are included in the data collection. In other cases, teams will conduct a two-stage cluster sampling process in which participants are chosen from within the cluster and serve as a sample group for the cluster. |
If your data analysis plans, as defined in your project management plan, include disaggregation by subgroup, your sampling method should specifically include those subgroups or strata of the population.
Stratified sampling is a strategy that allows you to analyze stratified groups within the larger population. Stratified sample A type of sampling method in which the population is divided into separate subgroups, called strata. Then, a probability sample is drawn from each subgroup, which allows for the statistical comparison of results within the sample.

For example, you may want to know whether there is a difference between the opinions held by large families (of five or more members) and small families (of less than five members) regarding whether or not they have enough water to meet their consumption needs. To collect this information, you will need a stratified sample that selects and identifies participants according to family size. Note that, generally, when you have a stratified sample, your overall sample size will need to be larger, which has implications for time and budget.
If you choose to create stratified samples, you will then need to revisit the random sampling methods in Figure 49 to decide which method will be used to identify your random sample (simple random, systematic or cluster sampling).
Step 3: Determining your sample size
Determining your sample size is important because the larger the sample size, the more likely it is that your sample will accurately represent the population.

How well a sample represents the population is gauged by two important statistics: the margin of error and the confidence level.
Margin of error expresses the maximum expected difference between the true population and the sample estimate. To be meaningful, the margin of error should be qualified by a probability statement (often expressed in the form of a confidence level).
Confidence level refers to the percentage of all possible samples that can be expected to include the true population parameter.
So, what do the margin of error and confidence level look like in practice? Let’s look at the two concepts using an example from the Delta River IDP Project. UNITAS conducts a questionnaire and learns that 50 percent of respondents report “washing their hands after critical events.” The confidence level for the survey is cited as 95 percent, with a margin of error of plus or minus 3 percent. This information means that if the survey were conducted 100 times, the percentage that reported “washing their hands after critical events” would range between 47 and 53 percent most (95 percent) of the time.

Decisions about margin of error and confidence level should be determined by MEAL experts on your team based on your information needs, the context you work in, and the resources available for MEAL. However, as a general guideline, the confidence level will increase (and the margin of error will decrease) as you increase your sample size.
Returning to the Delta River IDP Project questionnaire, let’s explore how sample size influences margins of error and confidence levels:
● A very small sample, such as 50 respondents, has about a 14 percent margin of error while a sample of 1,000 has a margin of error of 3 percent.
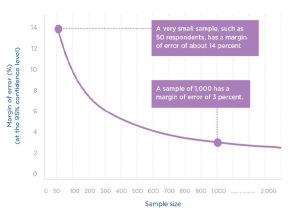
● To obtain a 3 percent margin of error at a 90 percent level of confidence requires a sample size of about 750. While a 95 percent level of confidence, would require a sample size of about 1,000.
Step 4: Selecting your sample units
When selecting your sample units, it is especially helpful if you can start by accessing a sample frame.
Sample frame A specific list of units (men, women, households, individuals, children, adolescents, etc.) that you will use to generate your sample. Examples could be a census list or a list of employed teachers, a registration log or a list of project participants.

If you do not have a sample frame or know that your frame is incomplete, you can use an alternative sampling selection approach. One option would be to use a random route method. This is a type of systematic sample that can be used when you don’t have a list of the total population. Sketch a map of the community. Estimate the total number of households in the community.
Calculate the number of households to be included in the sample. Then generate a random route through the community by selecting a starting point on the map and instructing the interviewer to turn left or right or go straight at each intersection. The interviewer then interviews one individual (often the household head) from every nth house (n will depend on the size of your sample) along this random route.
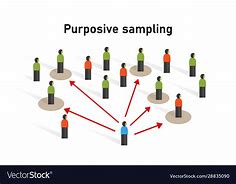
Purposive sampling
Purposive sampling is used primarily when you want to collect qualitative data. In this kind of sampling, your sample units are deliberately, rather than randomly, selected to reflect important features of groups within the sampled population.
Purposive (selective) sampling is a non-probability sample where sampling units that are investigated are based on the judgement of the researcher. Sampling units are selected based on characteristics of a population and the objective of the study.
Purposive samples are used to understand the experience or perspective of a particular group by gaining a “deep” understanding at the level of the individual participant. The information collected from purposive samples can provide a much deeper understanding of what is happening in your specific context.
It helps gain an understanding of the change you see, unpacking the meaning of the change and developing explanations for the change. These rich insights help you generate ideas, concepts and theories. However, because purposive sampling is non-random, the data collected from the sample cannot be generalized to the general population.
Steps to identifying a purposive sample include:
Step 1: Identify the type of purposive sampling you desire
As is the case with random sampling, start by clearly defining your population and sample frame. Establish sampling criteria that are very clear about the sampling units you intend to use. The clearer you are about your criteria, the more valid and reliable your study will be.
Next, select the sampling method you intend to use to identify your purposive sample.
There are different methods of purposive sampling.
| Purposive sampling method | Description |
| Best- and worst-case sampling | Compares communities or individuals who are considered best and worst cases based on certain characteristics. (I.e. most vulnerable and least vulnerable). |
| Typical case sampling
|
Provides an understanding of the general scenario by choosing those communities or individuals who are considered average |
| Critical case sampling | Collects information from communities or individuals who are important for understanding a particular context or situation. |
| Quota sampling. | Attempts to collect information from participants with characteristics of interest according to estimates of their proportion in the population |
| Snowball or chain sampling.
|
Collects information from participants in stages, starting with respondents known to the evaluators or partners and then asking those respondents for recommendations of who else to speak to. The advantage of this method is that it helps you identify sources of information previously unknown to |
Step 2: Determine your sample size
Sample size is calculated very differently in purposive sampling than in random sampling. Often, qualitative data are used to triangulate, or cross-check, quantitative or other qualitative data. Thus, purposive sample sizes must be considered with triangulation needs in mind. You need to conduct enough focus group discussions or interviews to test, reinforce and confirm the patterns that are emerging.
For example, if you use the best- and worst-case purposive sampling method to conduct focus group discussions on women’s opinions about access to water points, plan to conduct at least two or three focus group discussions to collect information from each perspective (best case and worst case).
Interestingly, this number of focus groups is recommended because experience tells us that 80 percent of themes about an area of interest are identified by two to three focus group discussions.
Furthermore, 90 percent of themes are identified by holding six to nine focus group discussions.
purposive sample sizes are decided based on the following factors:
● If the data analysis plan in your PMP requires that you compare subgroups, you will require a larger sample, and the size increases exponentially the more subgroups you have. For example, if you want to look at both large- and small-sized families, you will need to hold two to three focus groups for each of these subgroups.
● Budget constraints and resource limitations can influence your sample size decisions. You may need to limit the number of subgroups you compare (and associated data collection events) if you lack the resources to implement data collection events.
4.4 Using data collection tools
Once you have designed your tool and your sampling strategy, it is time to implement your data collection effort. However, before you can begin to collect your data, there are several steps that should be followed to ensure that your data collection is successful.

Step 1: Translate your data collection tools
Is your project working in a region that uses multiple languages? If so, then your tool will need to be translated so that it is not biased toward those who speak the initial language of your tool.
Step 2: Train data collectors and test your tools
Written instructions accompanying your collection tool are essential. Often, additional training is also needed, for both new collectors and as a refresher for those who are skilled. Training should include the following:
● An explanation of the basic ethical principles of good data collection. ● An explanation of the purpose of the tool. Make sure everyone using the tool understands the purpose of each question and how the answers received will feed into analysis and use. ● Instruction that emphasizes the skills needed to use the tool. Data collectors need skills to collect high-quality data. The skills needed for quantitative and qualitative data collection are often different. For example, when collecting quantitative data, enumerators need training to know the order of questions to ask and how to ask them without leading respondents. When collecting qualitative data, interviewers need to be able to elicit information from respondents while making them feel comfortable, and must create a trusting relationship with respondents while remaining neutral in attitude and appearance. ● The opportunity to physically test the tool with potential respondents.
Training data collectors serves two purposes: building the skills of your data collectors and ensuring that your tool works as it should. You must always test your tool, a process that can be built directly into your training. Physically testing the tool with potential respondents makes sure that:
● You will collect the data you intend to collect. ● Your questions are written using language that respondents and collectors understand. ● Your tools will not take too long to implement. You want to avoid situations where you put too great a burden on respondents and/or risk them losing motivation and focus. ● Your tools appropriately explain to respondents the ethical norms and standards related to informed consent, anonymity and confidentiality. ● Your data collectors have been sufficiently trained. They understand the tool’s instructions, the logical flow of the questions, and how respondent data should be recorded.
Step 3: Revise and finalize your tools
After you have tested your tool, any revisions can be incorporated into your final document.
Step 4: Plan for implementation and data management
As you plan your data collection activities, be sure to:
● Allow enough time for each data collection event. Remember that questionnaires should take no more than 45 minutes to implement, and that interviews and focus group discussions can take up to 90 minutes. You want to make sure you give participants enough time to answer questions completely, while not asking too much time from them. Furthermore, it is important to acknowledge that facilitating interviews and focus group discussions can be tiring. Don’t plan for a single facilitator to conduct more than two or three events in a single day (especially if they are 90 minutes long.) Planning too many events can result in errors and diminished quality.

● Choose a venue for interviews and focus group discussions that provides privacy and an appropriate level of comfort. You want to make sure your participants are as comfortable as possible, particularly if the subject matter is likely to be challenging.
● Identify how you intend to manage the data you collect. The specifics of data management are described in detail below. However, before you begin implementing your tool, take time to consider:
○ Who will be responsible for entering the data into the selected databases, if you are not using digital data recording devices. ○ Who will be responsible for conducting data quality checks and when. ○ How you will protect and store questionnaires once they have been completed. ○ How you will protect the privacy of respondents and who will be responsible for this function.

4.5 Managing data
Creating an effective data management system enables you to effectively analyze, interpret and use the data you collect.
Data management is the process of managing data through the phases of its life. Complete data management includes four primary components: entry, cleaning, storage and security, and retention and disposal.
Data entry:
The term “data entry” means putting the data you have collected into a form you can use by entering it into an electronic database. Effectively using a database improves your ability to:
● Access, manage and share data ● Improve data security and protection ● Integrate data more effectively ● Manage data quality ● Facilitate timely decision-making

The first question to ask yourself when thinking about data entry is, “What type of database(s) do we need?” As you explore options related to your database needs, you will quickly discover that your choices will directly inform your larger ICT strategy for MEAL.
In many cases, if you are managing quantitative data and only intend to complete relatively basic levels of analysis, common database software such as Microsoft Excel and Microsoft Access will often suffice.
However, projects that intend to conduct more complex analysis of quantitative data might choose to use statistical programs like Stata or SPSS. However, if you are managing qualitative data, your choice of software will depend on the quantity of data you are managing and the depth of analysis you intend to conduct. For relatively small-scale qualitative analysis activities, projects often use Microsoft Excel or Microsoft Word. Projects with more extensive qualitative analysis activities often choose to use computer-assisted qualitative data analysis software, or CAQDAS, such as NVivo, Dedoose, MAXQDA, and others.

Once a decision is made on which database will be used, the next step is to enter the raw data into the database. Increasingly, this step has been automated as projects adopt digital devices that synchronize the data collected in the field with the databases used to analyze MEAL data.
In practice, many projects need two databases, one that manages quantitative data and one that manages qualitative data.
Whether you are using digital devices or paper-based systems to collect data, follow these steps as you enter data:
Step 1: Create a data entry protocol
Inconsistent data entry procedures and data entry errors can compromise your data, analysis and MEAL findings. To reduce this risk, create a standard data entry protocol that includes guidance on:
● The data entry process, outlining the rules and instructions for entering data into the database. ● The timing of data entry to ensure that data are available to meet reporting requirements and decision-making needs.

Step 2: If necessary, identify your requirements for those entering data
Most data entry is now conducted electronically, often using digital devices to collect information that is then uploaded automatically into the project MEAL database. However, in some environments, there may still be a need to input data by hand. Any data entry protocols you create should clearly indicate whether those inputting data require previous experience or training. If appropriate, identify a supervisor who is ultimately responsible for quality management of the data entry process.
All data entry staff should be trained on the objectives of your data collection efforts, the data collection methods you are using, the database itself, and the protocol you set up for data entry. If those entering the data understand the big picture, they will be more likely to enter the data completely and cleanly. For example, they should be comfortable with the questionnaire layout and any skip logic included, and they should be aware of any potential errors in data collection.
Cleaning data
It is important that your project team confirms that your MEAL data are correct, complete and of the highest quality. With the increased use of digital devices to collect data, there is less risk of the transcription errors that result when transferring paper-based data to databases. Nevertheless, teams should still invest in data cleaning to help ensure that they are accurate and free of errors.
Data cleaning Detecting and removing errors and inconsistencies from data to improve its quality.
Some of the most common data cleaning methods include:
Conducting quality checks Randomly selecting and comparing raw data to the electronically entered data to check for data-entry and coding errors. Teams that use digital devices to collect data can skip this step.
Identifying outliers Checking whether there are unexpected entries in the data. This could mean that the person entering data does not understand the process and has made a coding error. For example, if a questionnaire asked a question about age, and an age of 110 was entered, you would quickly spot the error, and be able to prevent similar ones.

Removing duplicate entries Confirming that each data record (questionnaire, form, etc.) has a specific, unique identification number and that no numbers have been repeated in the database.
Keep a record of data errors, and review any observed trends and patterns in the errors with the data entry team to improve future results. In an environment where data is being entered automatically through electronic devices, this check should happen on the first day of data entry to make sure any systematic problems are identified and addressed.
Data storage and security
It is important to ensure that data are secure and protected against unauthorized changes, copying, tampering, unlawful destruction, accidental loss, improper disclosure or unauthorized transfer.
The data storage and security measures you put in place will naturally vary according to your situation, the level of risk assessed, the nature and sensitivity of the data you are collecting, and the local security and logistical conditions.
Risks can be as simple as recurrent problems with electricity supply—requiring regular backup policies—or as complicated as the need to create a special, secure database for particularly sensitive information. It is likely that your organization will already have a policy on issues such as the physical security of data, information technology security (i.e. the use of passwords), and the duties of staff to use data with discretion.
| Critical thinking: Understanding the European Union General Data Protection Regulation
Given the importance of data protection, the European Union enacted the General Data Protection Regulation, or GDPR, in May 2018. Its goal is to protect EU citizens from privacy and data breaches.
While this may initially seem irrelevant if you are working outside of Europe, keep in mind that the regulation affects all organizations working inside the EU and anyone who is offering goods or services to, or monitoring and evaluating the behavior of, EU data subjects, regardless of their location. Given the global nature of their work, many organizations are changing their policies as a result, no matter what their location. The primary benefit to the individual resulting from the GDPR is that the conditions for consent to use data have been strengthened. Organizations can no longer use a person’s data without clear consent. And, they cannot obtain that consent in unclear ways. A request for consent must be clearly indicated using plain language that can be understood by everyone. Additionally, individuals have the right to access their data and to “be forgotten” if they desire. Efforts to protect the individual’s privacy and their data must be part of the initial design of any data management system.
|
Data retention and de-identification
When it has been decided that data are no longer needed—either following the end of the project, or during the implementation of the project—all records and backups should be disposed of or adjusted so that it is impossible to identify the data respondents.

Data disposal:
The method you use to destroy data and records will depend on the following factors:
● Applicable laws ● Organization’s policies and donor requirements ● Local operating context ● Sensitivity of the data that require disposal ● Volume of data that require disposal

Another factor that will determine the method used to destroy data is its format:
● Paper records. Any paper records should be destroyed by burning or shredding. They should not be able to be used again or reconstructed in the future. ● Electronic records. Destroying electronic records should be the responsibility of an IT professional with knowledge of how to eliminate all traces of the files. Disk drives and databases should be completely purged and data on rewritable media—such as CDs and DVDs, audio and video tapes—completely erased before reuse.
De-identification: If you choose to retain data following the end of project activities, you can conduct a de-identification process to maintain respondents’ anonymity.
Anonymization and pseudonymization are two techniques that you can use to de-identify data.
● Anonymization Stripping data of any identifiable information, making it impossible to derive insights on a discrete individual, even by the party that is responsible for the anonymization.
● Pseudonymization Replacing personally identifiable information fields with a code that protects a respondent’s identity. However, with the use of a data “key,” the individual’s identity can be accessed.
Not a member yet? Register now
Are you a member? Login now